This SIPOC diagram example, created in an Excel worksheet, provides a high-level overview of the data analysis process and helps define process boundaries to identify opportunities for improvement.
This 5 Whys example explores the underlying causes of the high turnover rate among young employees over the past two years, as reflected by a turnover rate of 23.6%.
This PowerPoint template serves as an SOP for new hire orientation. It standardizes the onboarding process, helps new employees align with their roles, and provides opportunities to connect with colleagues.
This SOP template is formatted to fit a single page in landscape orientation, which offers a clear and concise overview for quick reference and ease of use.
This SOP template is structured to fit a single page in portrait orientation, which allows for more detailed content while maintaining readability and user-friendliness.
This is an Excel worksheet example of an SOP for new hire orientation. It outlines key onboarding steps, supports new employees in understanding their roles, and facilitates engagement with team members and the broader organization.
This example uses an Excel-based fishbone diagram structured around the 6Ms (Man, Method, Machine, Material, Environment, and Measurement) to illustrate rising health concerns in a restaurant.
This example uses a fishbone diagram template in an Excel worksheet, based on the 6Ms, to analyze rising health concerns in a restaurant, reaching Level 2, which represents the Secondary Cause Level of an effect.
This example uses an Excel-based fishbone diagram, structured around the 6Ms, to analyze rising health concerns in a restaurant. This example traces causes down to the third level of an effect.
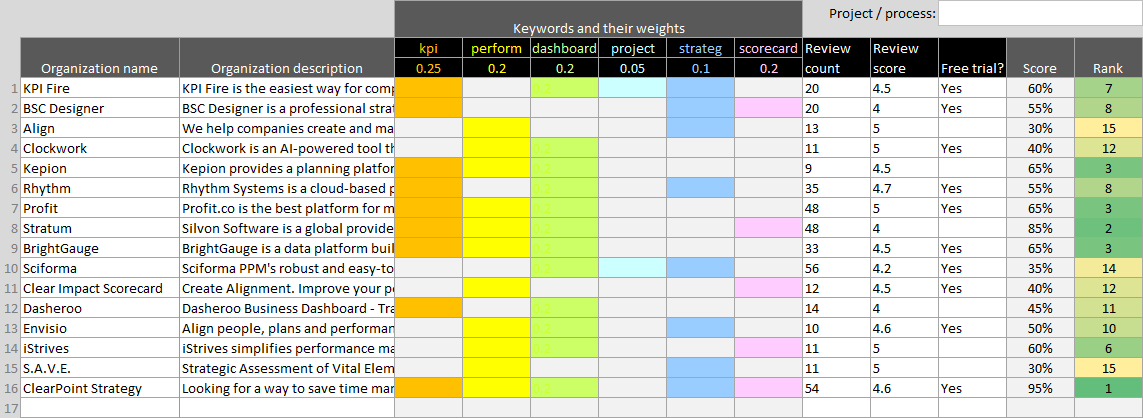
This is an example of an exercise conducted to identify and select relevant benchmarks in the field of information technology, which can serve as a foundational step before undertaking a comprehensive benchmarking analysis.
This is a generic example of randomly entered data for four manufacturing organizations, used to perform monthly comparisons based on performance metrics such as spoilage and material usage.
This time value map example measures patient flow in a clinic, starting from the moment a patient enters the clinic until they exit. The goal is to identify how much time is spent on value-added versus non-value-added activities throughout the entire process.
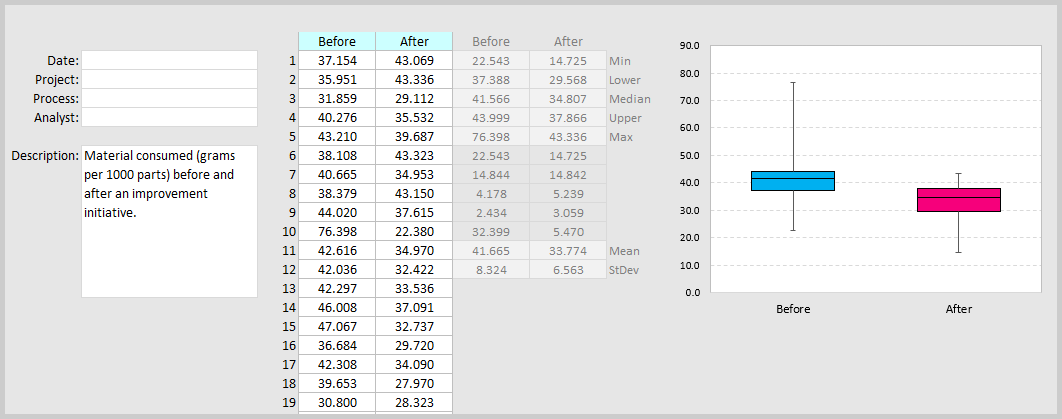
This example demonstrates how to use the box plot template to analyze changes in material consumption at a manufacturing facility before and after implementing an improvement initiative.
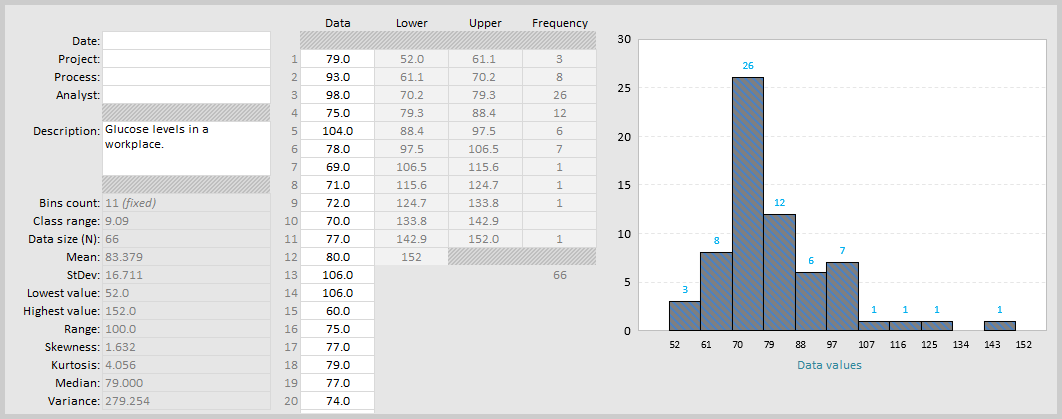
This is an example of a histogram generated using sample data of product weights collected from a manufacturing process. This visualization helps the quality control team identify whether the product weights are consistently within the desired range or if there are any outliers or shifts in the production line.
This scatter plot illustrates the relationship between the number of fouls committed and the total points scored by twelve basketball players over the course of a season. It helps identify whether there is a pattern or correlation between a player’s scoring performance and their tendency to commit fouls.