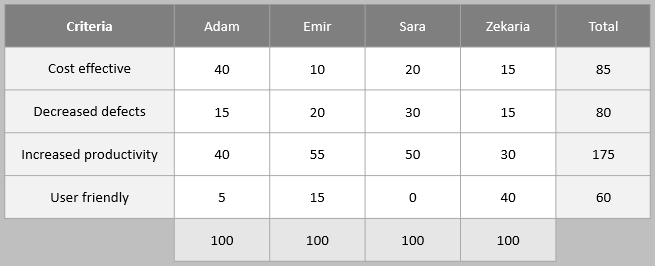
In this example, each team member has distributed 100 points between the selected criteria to weight them before conducting the prioritization exercise.
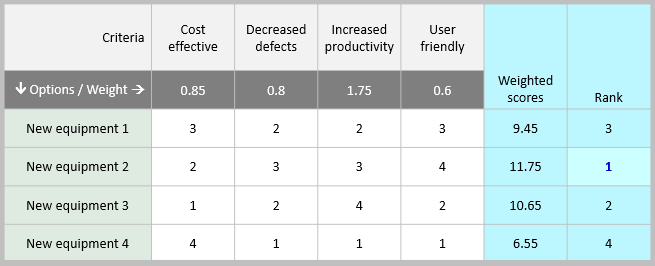
In this example, the team has used the prioritization matrix to select an equipment among 5 alternatives.
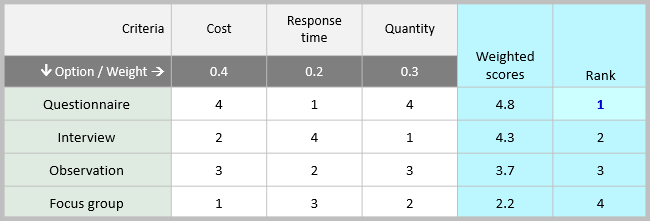
This example illustrates a prioritization analysis that was conducted to select the most efficient data collection method at a workplace. Note that high score of cost doesn’t mean that the cost is high, but low or “cost-effective”.
This example illustrates a prioritization analysis that was conducted to select the most efficient data collection method at a workplace. Note that high score of cost doesn’t mean that the cost is high, but low or “cost-effective”.
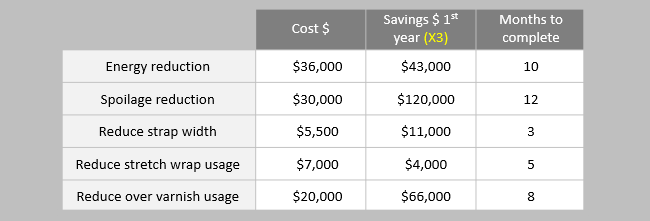
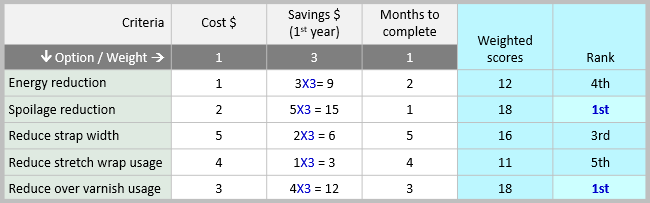
A manufacturing company needs to select two projects to be implemented this year. It was agreed that ‘savings’ should be given a weight of 3 as it is relatively more important than the other two criteria.
In this example, a team has used the prioritization matrix to select the most profitable among five candidate projects.
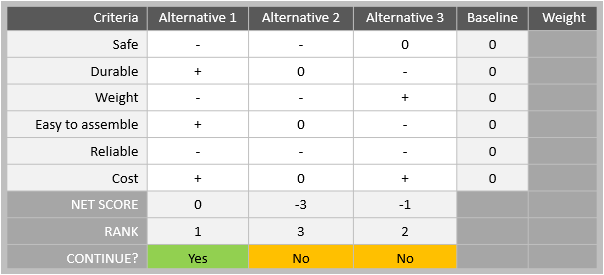
Example of a pugh matrix to select the best concept from among three alternatives.
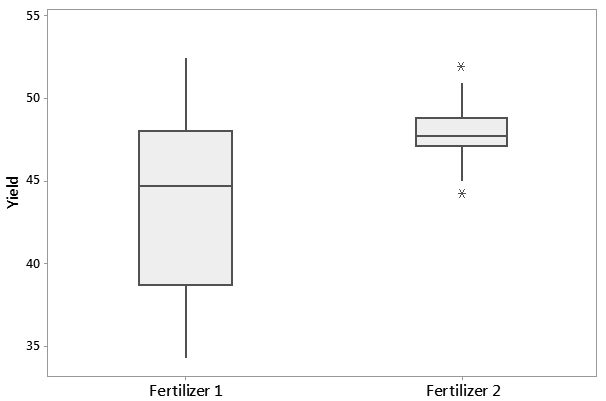
The following are boxplots that display the yield of a crop after applying two different fertilizers. Fertilizer 2 appears to have a higher yield than Fertilizer 1.
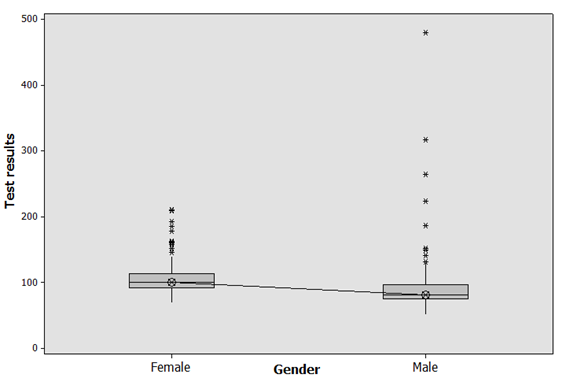
This example shows that females have higher glucose levels than males in a workplace. ANOVA can be used here to test the significance of the difference between the two means.
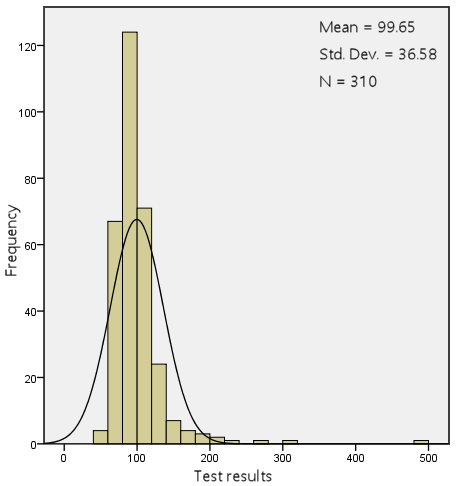
In this histogram, the distribution of the data is skewed to the right.
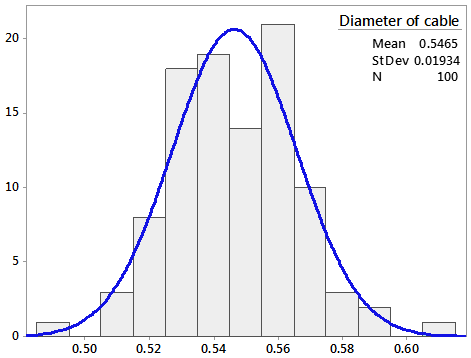
In this histogram, the distribution looks symmetric around the cable diameter mean and appears to fit the Normal Distribution fairly well.
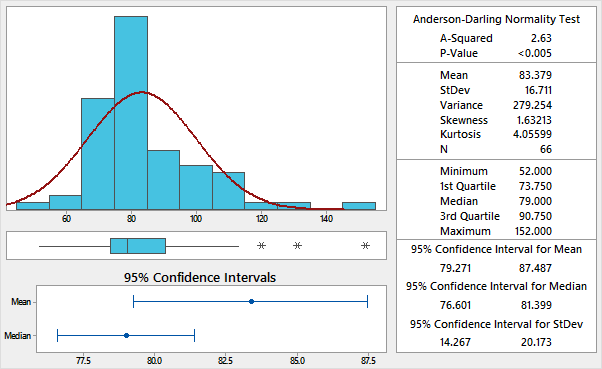
Many statistical applications allow the option of summarizing your data graphically. This can reveal unusual observations before performing detailed statistical analysis.
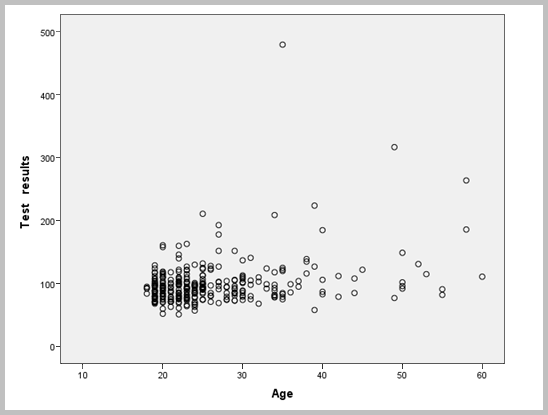
This analysis was conducted for diagnosing the presence of diabetes at a workplace. It suggests that there is no obvious relationship between age and glucose levels.
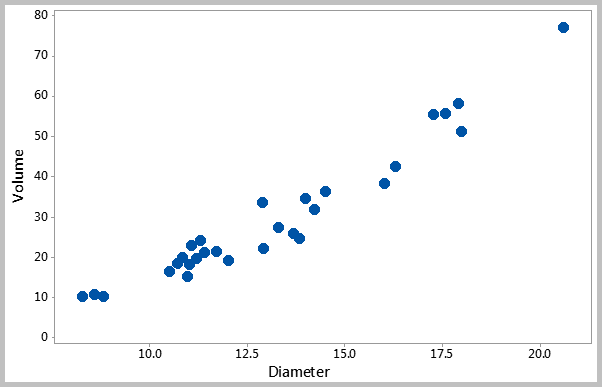
This is an analysis that shows the relationship between two variables. The scatter diagram suggests that the two variables are correlated. (Data source: Minitab Inc)
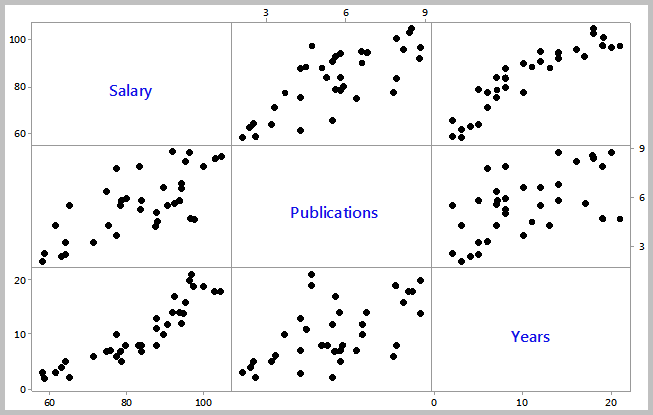
In this matrix plot, it appears that there is a positive relationship between the years of experience and salaries. (Data source: Minitab Inc)