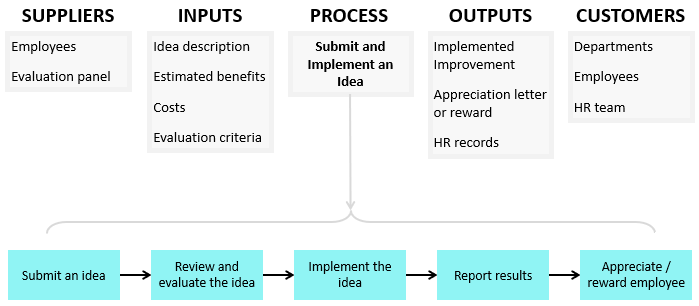
This is an example of a SIPOC map for an idea generation and implementation process.
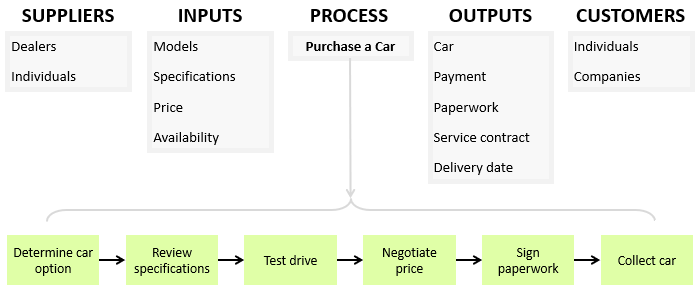
This is an example of a SIPOC map for a car purchasing process at a car dealership.
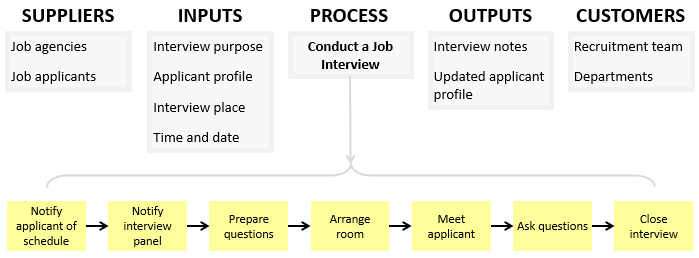
This is an example of a SIPOC map for conducting job interviews during a recruitment process in a company.
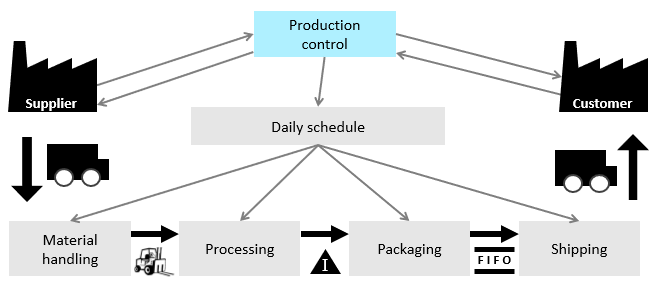
This is an example of a current state value stream map for a typical manufacturing process.
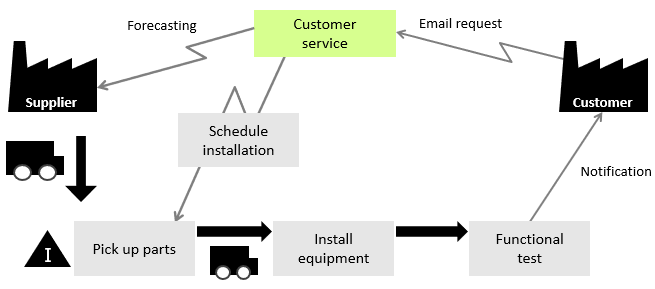
Value stream mapping can also be applied in service-related industries such as healthcare, hospitality and logistics. This example illustrates a value stream map for an equipment installation process.
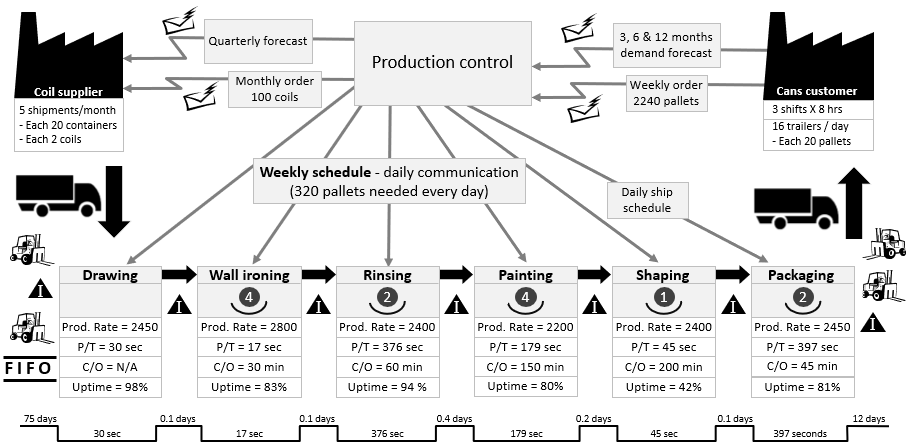
This is an example of a current state value stream map that was created for a specific product family in a manufacturing facility.
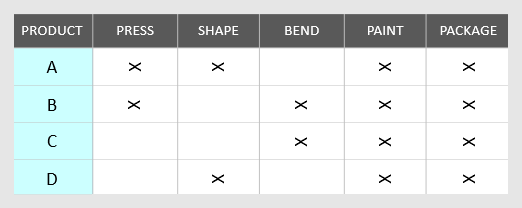
This is an example of a product family matrix which can help choosing the product or family of products that will be of most value.
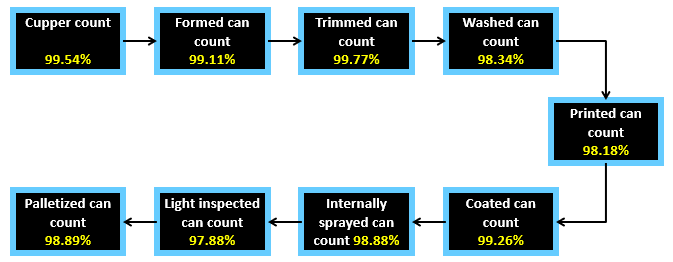
In this can-making process example, the probability of manufacturing a can that meets all performance standards would be 90.28% (i.e. RTY = 90.28%).
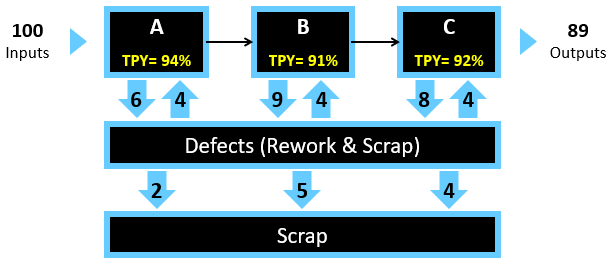
This is a process that has 3 steps performing at a 0.94, 0.91 and 0.92 respectively. If 100 units entered the process and only 89 were good units, final yield would be 89%, and rolled throughput yield would be: 0.94 x 0.91 x 0.92 = 78.7%.
An example of a process sequence chart for inspecting samples in a production line, which is a man-type process sequence chart.
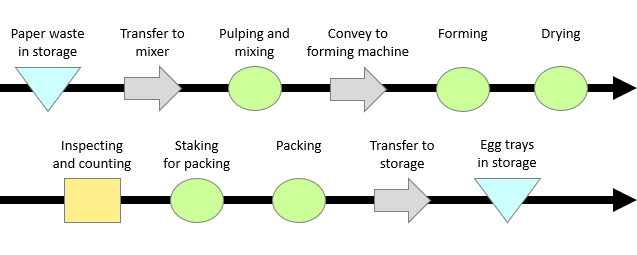
A process sequence chart that was prepared for an egg tray production line. This is an example of a material-type process sequence chart.
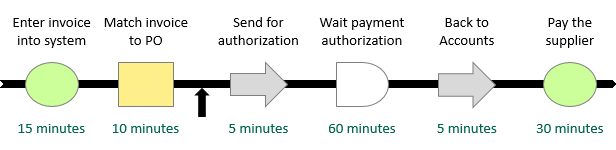
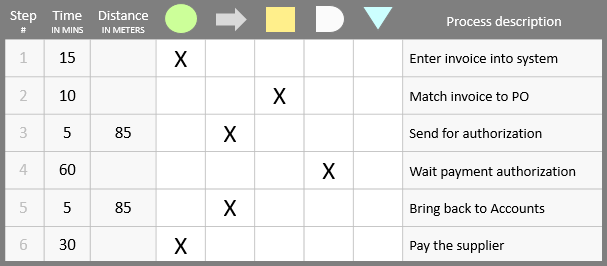
An example that uses the process sequence chart for processing an invoice after received by the supplier. The process begins after receiving the invoice and ends with paying the supplier.
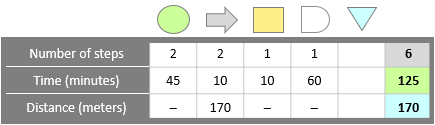
An example of a process chart summary, which is useful to estimate key performance metrics such as the total time to perform a process and the distance travelled.
An example that uses the process chart for processing an invoice after received by the supplier. The process begins after receiving the invoice and ends with paying the supplier.
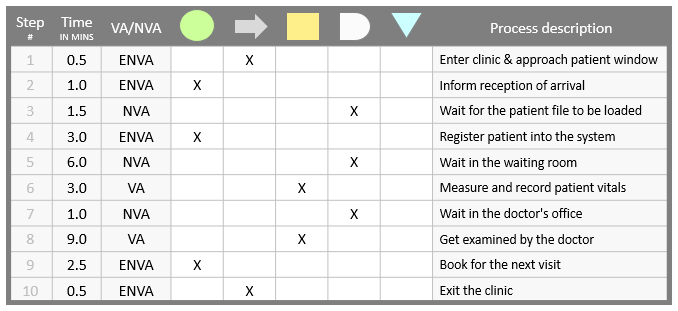
In this example of a time value map that illustrates the patient sequence process in a clinic. The process begins when the patient enters the clinic and ends when he/she exits the clinic.