This example uses a Project Risk Register template in Excel format to document all project risks along with their key attributes. The template is organized into three main sections: Risk Identification, Risk Analysis, and Risk Response.
This example uses a project risk register template to document all project risks along with their key attributes and includes a heat map that visually highlights the impact and likelihood of each risk.
This example is about a dynamic excel-based dashboard that provides a high-level summary of the risks identified in the corresponding Project Risk Register worksheet. It visually displays risks based on their impact and likelihood of occurrence.
This example uses the Safety Maturity Assessment Template to illustrate how the dashboard appears after completing the eight sections with your audit findings. The results are displayed on a radar chart for easy visualization.
This worksheet, focused on the First Aid and Accident Reporting dimension, is part of the Safety Maturity Assessment Template. Along with the other category-specific worksheets, it helps evaluating the overall level of safety maturity for any facility.
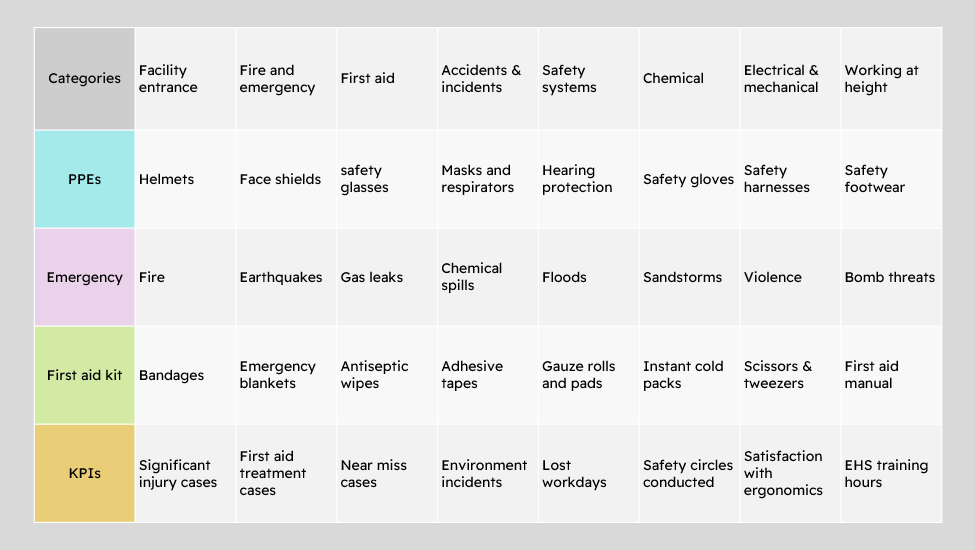
This tabular illustration is part of the Safety Audit worksheet, which can serve as a basis for designing more detailed checklists based on the safety information it contains.
This L-shaped matrix diagram example analyzes ten vehicle models against seven characteristics. The results can then be used to make informed decisions by first prioritizing models and then selecting the most suitable one.
This is an example of a T-shaped matrix diagram used to allocate employees to improvement projects based on their skills. This type of diagram enables the analysis of how two sets of data relate to a third one.
This is an example of an X-shaped matrix diagram used to monitor production and storage areas to help a production team optimize resource allocation and improve coordination with customers.
This is an example of a Y-shaped matrix diagram used to align projects with current capabilities across four manufacturing plants, which helps to ensure efficient resource utilization and decide who should do what.
This safety audit checklist is designed to assess the level of health and safety implementation and maturity within any facility. It focuses on three advanced categories: chemical safety, electromechanical systems, and environmental controls.
This safety audit checklist is designed to assess the level of health and safety implementation and maturity within any facility. It focuses on three basic categories: facility entrance, fire and emergency preparedness, and first aid and accident reporting.
In this real-life example, a team used a four-quadrant matrix to generate ideas for enhancing digital marketing strategies within a company based on two criteria: cost and relevancy.
In this example, a team used a four-quadrant matrix to select the most appropriate improvement projects based on two key criteria: potential impact and ease of implementation.
This is an illustrative example that uses a four-quadrant matrix based on the Eisenhower Method (Importance-Urgency Matrix) to help prioritize work and personal activities, improve time management, and focus on what truly matters.