This business process management example uses a project approach PowerPoint template that offers a structured framework of up to four phases. It outlines key activities and deliverables within each phase to support clear planning and communication.
This business growth exploration example uses a project approach PowerPoint template that offers a structured framework of up to four phases. It highlights key activities and deliverables within each phase to support clear planning and communication.
This business process management example uses a project approach PowerPoint template structured around the four phases of the PDCA cycle. It outlines key activities and deliverables in each phase to support clear planning and effective communication.
This example, from a project on documenting QA and content review, uses the simplest status report template, which includes basic fields such as key accomplishments, risks, key decisions, and upcoming activities.
This example, from a project on documenting QA and content review, uses an advanced status report template. In addition to the primary fields, such as completed activities, risks, key decisions, and upcoming tasks, it includes advanced attributes like key metrics.
This example uses the vertical swimlane flowchart template to clearly illustrate the steps involved in initiating a proposal within a management consulting firm from receiving the RFQ to submitting the final proposal.
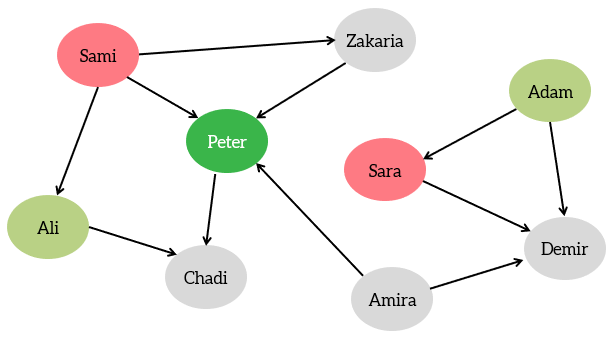
This example shows how relationship maps can be used to analyze the indirect influence patterns between team members in order to enhance the interactions and mutual acceptance.
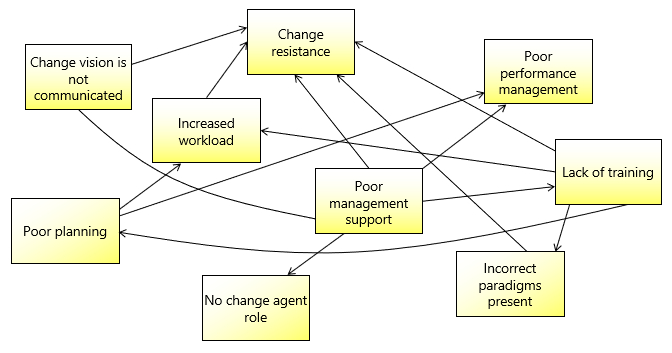
This is an example of an interrelationship diagram that was created by a team to identify the reasons why a change initiative within a company has failed to bring the anticipated benefits.
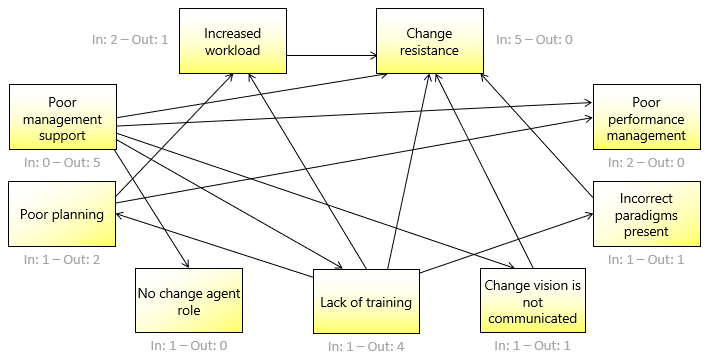
This is an example of an organized interrelationship diagram to identify the reasons why a change initiative within a company has failed to bring the anticipated benefits.
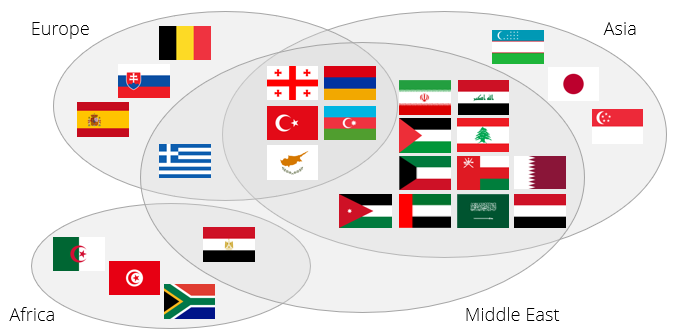
This Venn diagram indicates how most Middle Eastern countries are distributed across three continents.
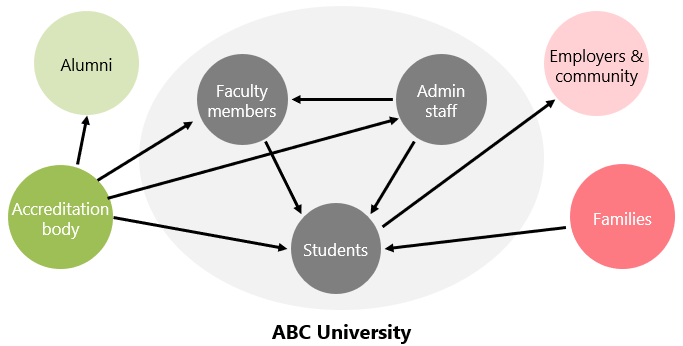
This system diagram clarifies how the university system works generally within a specific university.
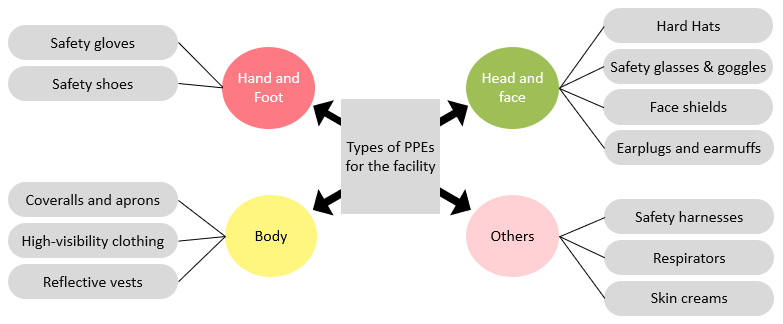
This concept diagram illustrates the types of personal protective equipment (PPE) that need to be integrated into a new manufacturing facility.
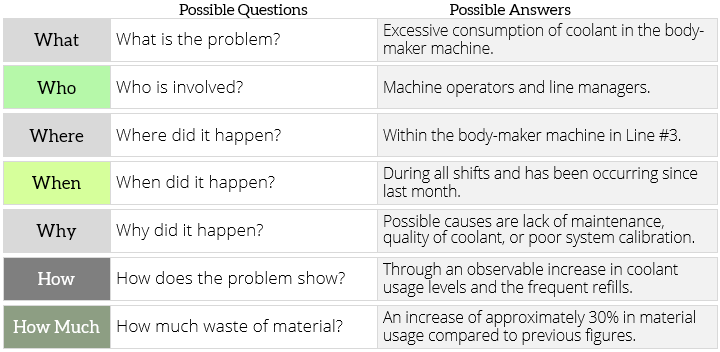
The following example applies the 5W1H technique to address a problem in a manufacturing environment.
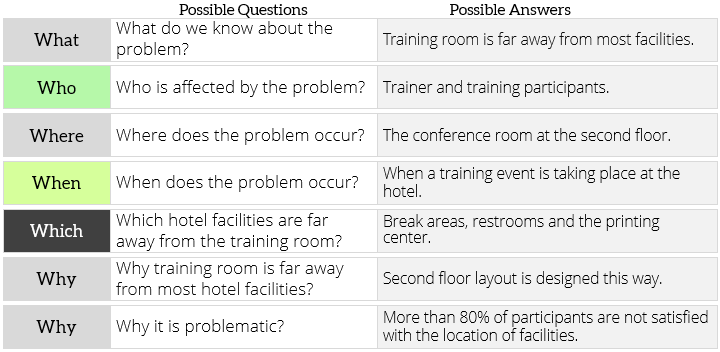
The following example applies the 5W1H technique to address a problem within the hotel industry.
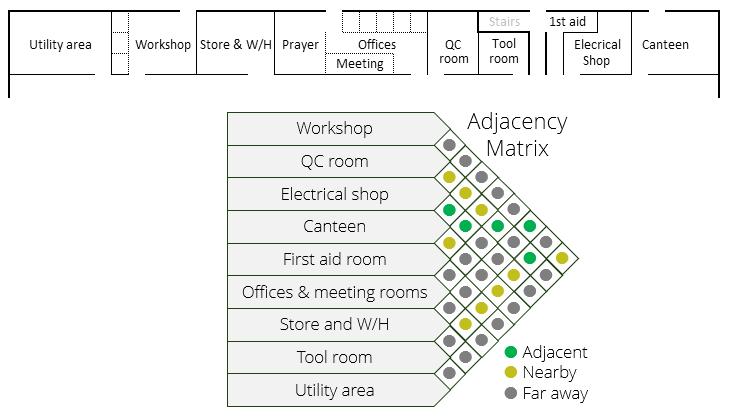
The following correlation matrix is created in a facility to analyze and reorganize rooms and areas in a way that supports workflow efficiency and enhances teams’ collaboration.
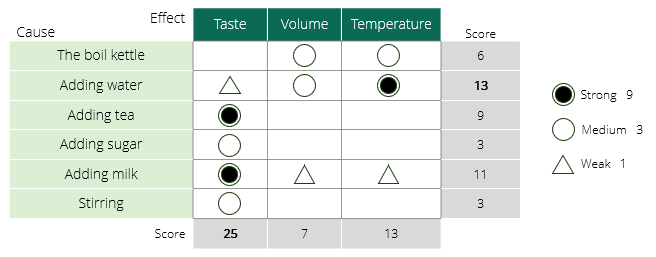
This example uses an L-shaped matrix diagram created by a coffee shop team. It illustrates the cause-and-effect relationship to enhance the quality and flavor of the tea they provide.
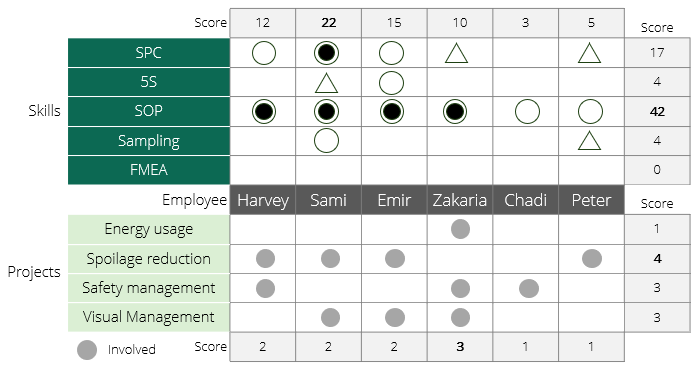
A program manager decided to use a T-shaped matrix diagram to help allocate human resources to multiple improvement projects. It is important for those working on the spoilage reduction project, for example, to have basic knowledge of statistical process control (SPC).
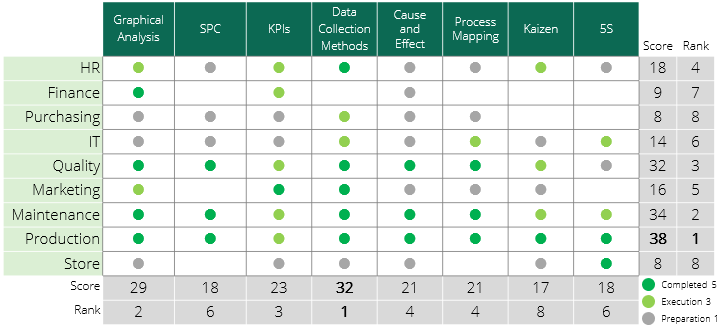
This example illustrates the workshops attended or conducted by each department in an organization during a change management process. Note that high scores in columns suggest workshops in their final stages, while high scores in rows suggest departments with significant progress.
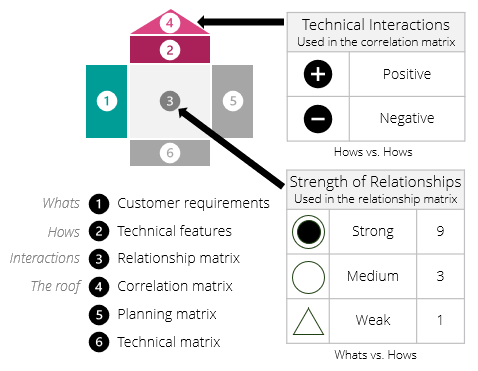
There are many versions of the House of Quality. This illustrates the main building blocks and symbols used for a typical House of Quality diagram.
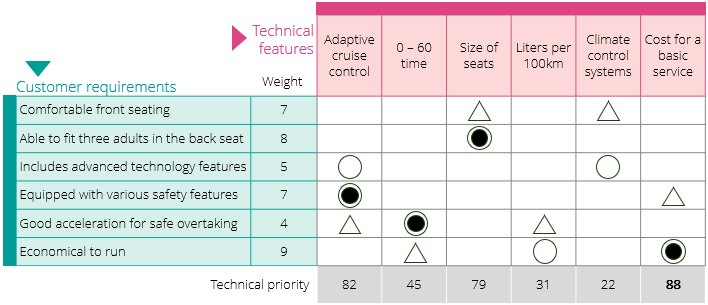
Here is an illustrative example created by a car manufacturer to analyze customer requirements when purchasing a car. Note that this example is simple, generic, and uses only a single matrix (the relationship matrix) to demonstrate the key elements.
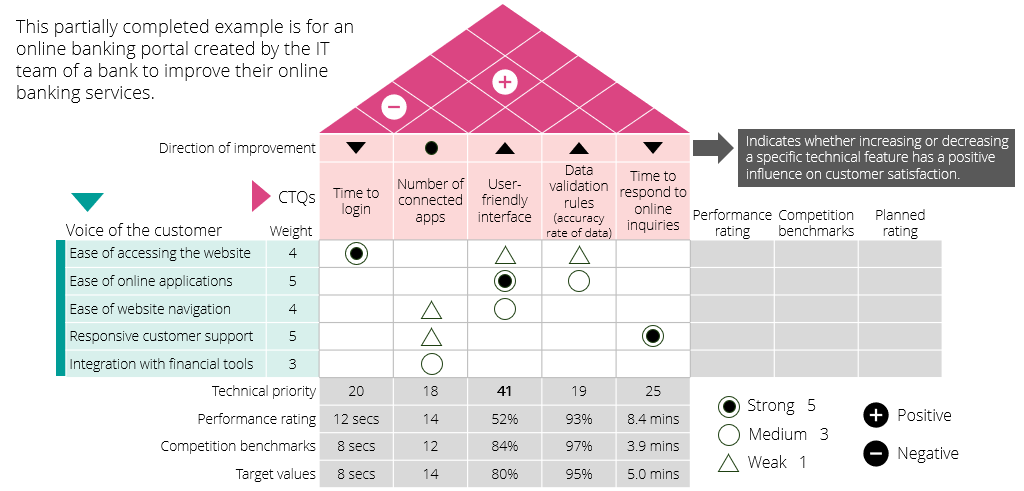
This partially completed example is for a House of Quality diagram for an online banking portal created by the information technology team of a bank to improve their online banking services.