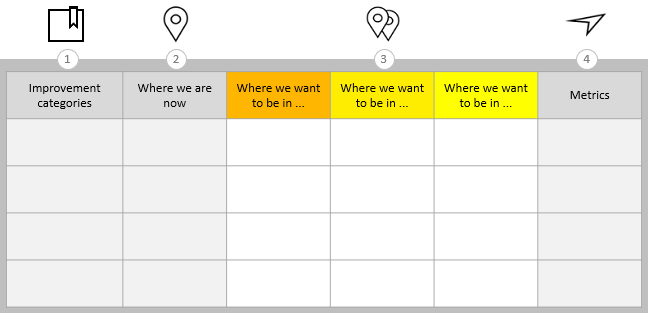
This is an example of an improvement roadmap template in its simplest format which contains only four sections.
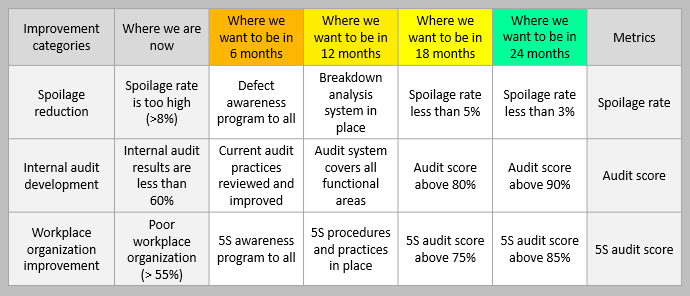
This example illustrates an improvement roadmap that was created to improve throughput and efficiency in a workplace.
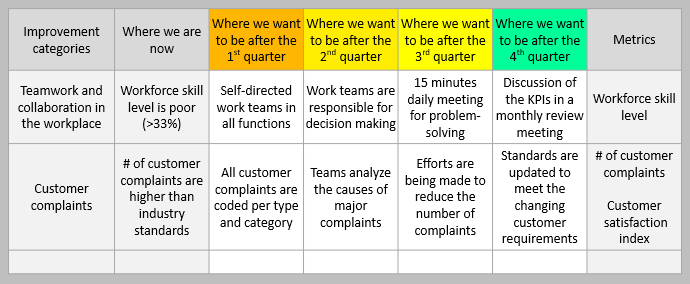
This example illustrates a short time frame improvement roadmap which has been created for the non-operational functions (human resources and customer services).
This example illustrates a short time frame improvement roadmap which has been created for the non-operational functions (human resources and customer services).
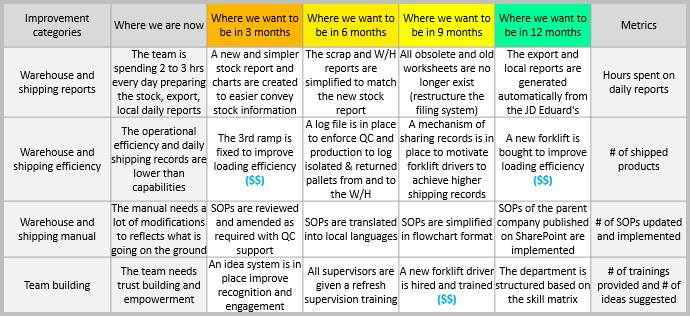
This is an example of an improvement roadmap that was created to improve the shipping and warehouse department at a manufacturing company.
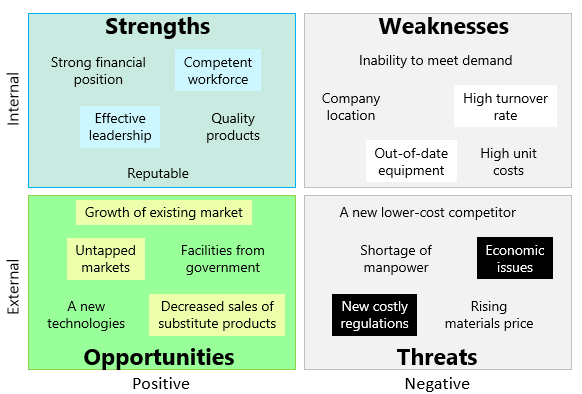
This example uses a four-field matrix to present the outcome of a SWOT analysis for an organization.
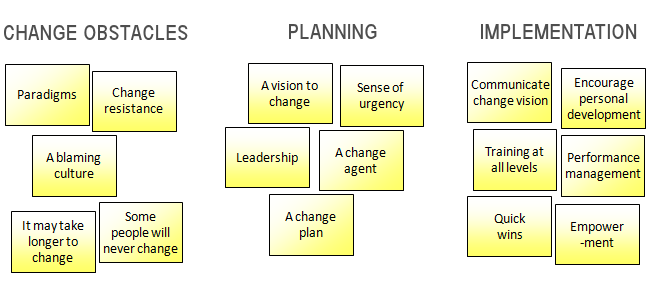
This is an example of a completed affinity diagram which has been developed after a brainstorming session, and which identifies how to successfully implement and sustain change within an organization.
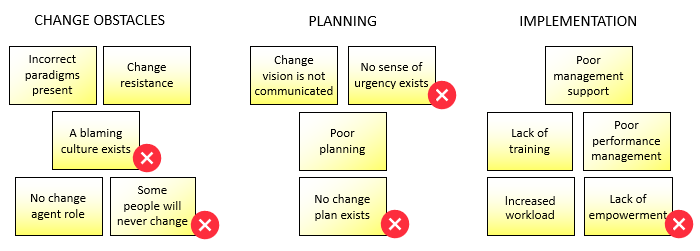
These ideas were collaboratively developed by a team to identify the reasons why a change initiative within a company has failed to bring the anticipated benefits.
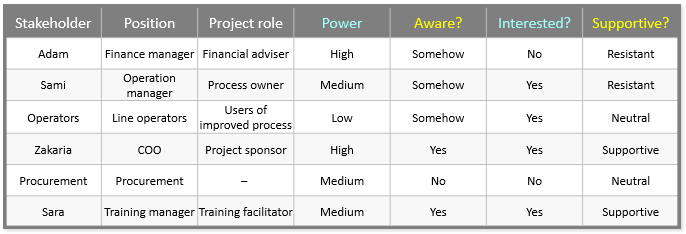
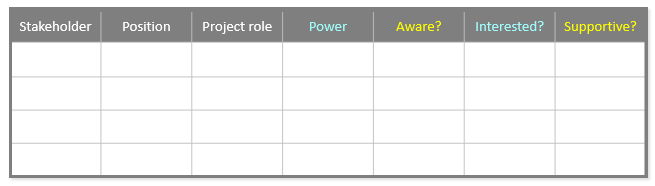
This is an example of a table that is used to summarize the roles and characteristics of stakeholders in order to analyze their level of involvement.
This is an example of a table that is used to summarize the roles and characteristics of stakeholders in order to analyze their level of involvement.
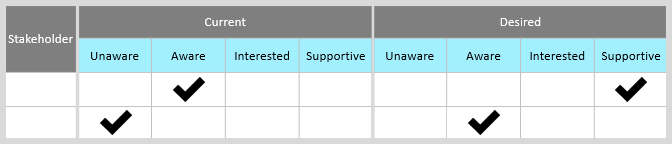
This is an example of an involvement planning worksheet which will help to assess where stakeholders are now and where they need to be in terms of project involvement.
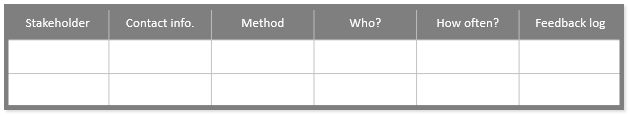
This is an example of a communication action worksheet which is used to plan how to communicate with project stakeholders.
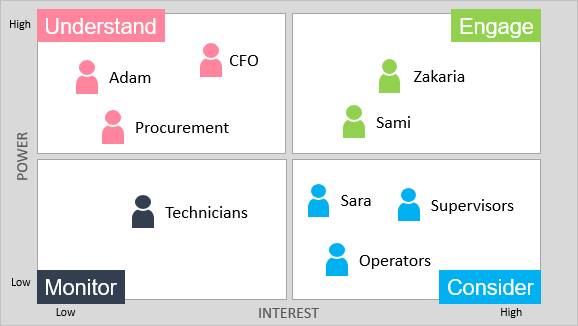
This power-interest matrix example illustrates the two main characteristics of stakeholders (power and interest) which will help to analyze stakeholders.
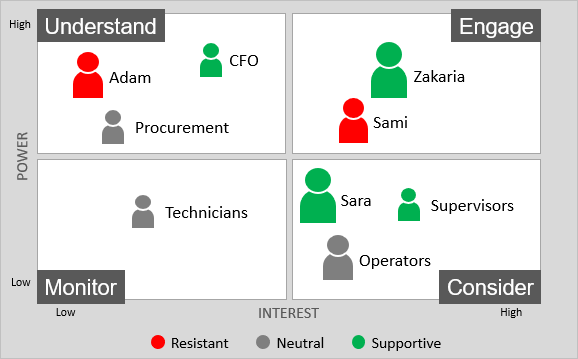
This power-interest matrix example illustrates three characteristics of stakeholders: power, interest, and support.
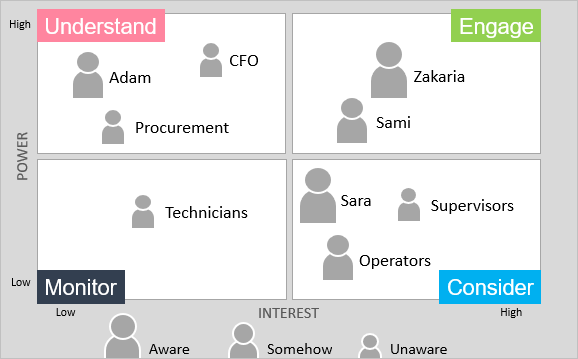
This power-interest matrix example illustrates four characteristics of stakeholders: power, interest, awareness, and support.