Blog
-
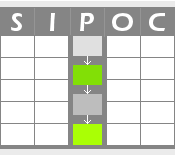
SIPOC Map Template
A SIPOC map is a tool that provides a high-level view of the key elements within a business process. It is widely used in process design and improvement initiatives, such as Six Sigma, to clearly define the scope of process improvement projects.
-
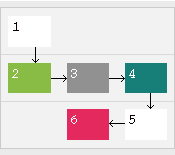
Process Map Template
A process map is a graphical representation for understanding any process. Process maps are simple ways of making sense of what happens or should happen in a clear and straightforward format. There are many software applications and online services for drawing process maps. However,…
-
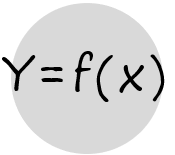
What is a Process?
The products and services delivered by any organization are outcomes of processes. Any business activity whether it is industrial, commercial or service-oriented can be considered as a process. Effective management of these processes is key for organizational success. A process can be defined is…
-
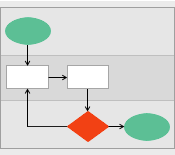
Flowchart Template
A flowchart is a diagram that illustrates the sequential steps of a process. It allows to draw the movement of materials, products, people, documents, and other elements, aiding in the understanding, analysis, and communication of the process. There are many software applications and online…
-
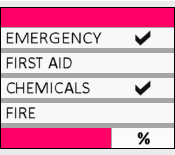
Safety Audit Checklist
Commitment to occupational health and safety is considered an important step toward achieving safe and productive working conditions. A safety audit checklist is a tool that helps evaluating the safety conditions and practices within in any workplace and in accordance with common standards and…
-
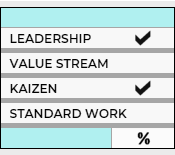
Lean Audit Checklist
This Lean audit checklist can be used to evaluate the progress of Lean implementation within any facility. It allows to understand the strong areas as well as the areas that need to be improved. An action plan for improvement can then be developed and…
-
Simplifying Complexity: How the Four Field Matrix Reshapes Thinking
Also known as Quadrant Chart, Four-Quadrant Matrix, Four-Celled Matrix and Two-by-Two Matrix. The Four-Field Matrix is an effective model for planning, organizing and making decisions. It is a two-dimensional chart that consists of four equal-sized quadrants, each describes a different aspect of information. This…

-
Graphical Analysis
Graphing the data can be utilized for both historical data already available and when analyzing the data resulting from live data collection activities. Of course, you need to pick the right graphical tool as there are a lot of different ways to plot your…

-
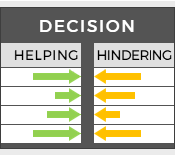
Force Field Analysis Template
The main idea behind the force field analysis technique is to identify the forces that help or hinder an organization in reaching a particular goal or intended change. This decision-making methodology is particularly valuable for leaders and change agents to analyze the pros and…
-
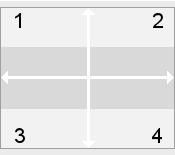
Four-Field Matrix Template
A four-field matrix is an effective model for planning, organizing and decision-making. This two-dimensional chart provides a logical framework for organizing ideas and information. This four-quadrant matrix template is a Microsoft PowerPoint presentation file that you can use and modify to meet your specific…
-
Responsibility Log Template
A responsibility log template allows team leaders to track the duties and responsibilities of their team members. It can be used when managing projects to ensure everyone knows what they’re responsible for. It is also useful as a delegation log where responsibilities are delegated…
-
Project Closure: The Final Activity in Project Management
Projects are time-bound by nature, necessitating execution within predefined timeframes. The Project Closing phase is the final step of the project life cycle and holds considerable significance in the context of organizational accountability. It is, however, one of the most overlooked project management activities.…