Blog
-
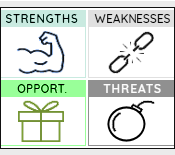
SWOT Analysis Template
The primary objective of conducting a SWOT analysis is to understand the internal and external factors influencing the performance of a business. The outcome of any SWOT analysis workshop should provide the basis for further analysis and actionable strategies. It is designed to enable…
-
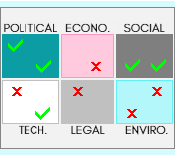
PESTLE Analysis Template
The aim of PESTLE analysis is to understand how macro-environmental factors affect the performance of an organization, then take appropriate actions to adapt to the changing environment. It brings together six external perspectives that serve as useful input into the strategic planning process of…
-
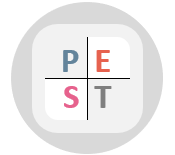
Adapting to Change: Using PEST Analysis for Better Decision-Making
Also known as Environmental Scanning Analysis. Related topics include STEEPLED and PESTLE. PEST analysis is a strategic and structured tool for evaluating the external environment of an organization. It allows any organization to understand the macro-environmental factors that affect its performance and its ability…
-
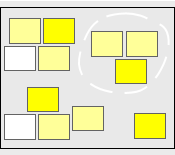
Affinity Diagram Template
An affinity diagram is a valuable tool when you need to organize a lot of ideas or information to make sense of them. It is commonly used to capture and group the output of brainstorming sessions in order to organize the generated ideas. There…
-
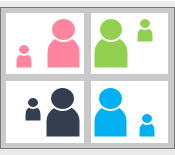
Stakeholder Analysis Template
Stakeholder analysis is a systematic process aimed at identifying and analyzing the stakeholders that are likely to affect or be affected by a particular company activity. Its main goal is to help improve communication and plan engagement with stakeholders. It is widely used in…
-
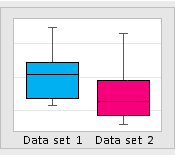
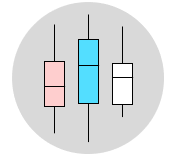
Box Plot Template
A box plot is a graphical representation that illustrates the frequency of numeric data values for a given variable. This visualization indicates where most of the data is grouped and how much variation there is in the data. Box plots are particularly useful when…
-
The Role of Box Plots in Comparing Multiple Data Sets
Also known as Box-and-Whisker Plot and Whisker Plot. A box plot is a graphical representation that shows the frequency of numeric data values. It is mainly used for exploring data patterns as well as to present the data in an easy and understandable manner. Box plots…
-
The Role of Histograms in Exploring Data Insights
Also known as Frequency Distribution Diagram. Related topics include Dot Plot and Pareto Chart. One of the best methods for analyzing any process involves the graphical representation of data through the utilization of graphs or charts. Among these graphical tools is the histogram, which…
-
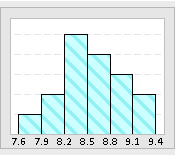
Histogram Template
A histogram is a bar chart used to show how data is distributed. It provides insights into the central tendency of the data and the degree of variability presented in the process. This histogram template is designed to enter up to 100 individual data…
-
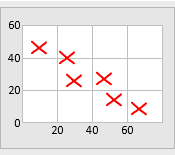
Scatter Diagram Template
A scatter diagram is a graph that facilitates the visualization of the relationship between two variables. Its primary purpose is to check if changes in one variable are associated with changes in the other variable. For example, a scatter diagram can be plotted to…
-
Value Stream Map Template
A value stream map is a strategic tool that provides a high-level view of the important elements of an end-to-end operational process. Its primary goal is to identify waste and areas where improvement can be made in the current workflow. It is mainly used…
-
Process Yield Calculator
Process yield measures are metrics used to better understand process yield. These metrics should be able to reveal even the smallest inefficiencies in the process in to order to improve process efficiency and capability. The primary objective of process yield measures is to assess…