A process map is a graphical representation for understanding any process. Process maps are simple ways of making sense of what happens or should happen in a clear and straightforward format. There are many software applications and online services for drawing process maps. However, this process map template offers an easy and user-friendly approach for creating customizable process maps.
This template is a Microsoft PowerPoint presentation file which you can use and modify to suit your specific requirements. For example, you may want to add an additional grid to the time-function process map or change the attributes at the header to match your company’s standards. The template is also expandable to the extent that it can include large process maps that span multiple pages using connectors.
Moreover, this template comes with pre-made textboxes which simplify the drawing process. Simply enter your process steps in these textboxes, and then drag and drop them into the appropriate places on your process map. The template is available in three different variations, so you can choose the one that suits your needs best.
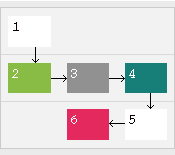
- Simple-drawing – The basic form of process maps that uses only boxes and arrows.
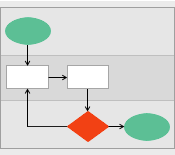
- Time-function – Displaying time on one axis and function on the other.
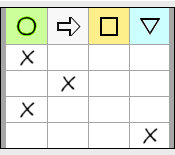
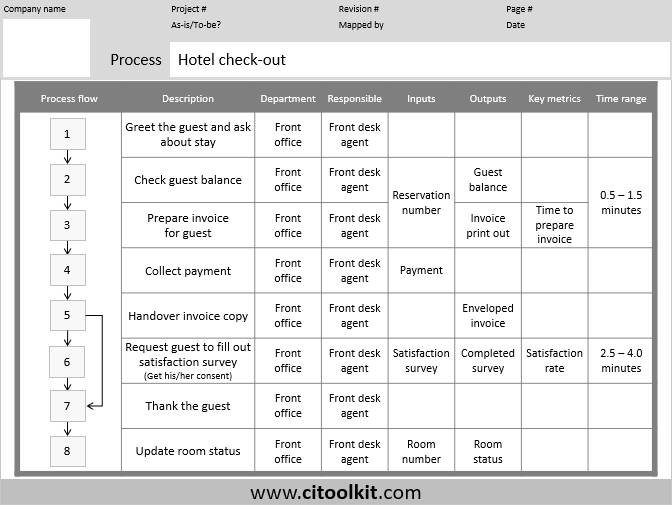
- Tabular format – More information can be displayed in process maps including inputs, outputs, performance metrics, responsible persons, and the duration required for each activity.
Process Map Template (84 KB)
Process Map Template Examples (88 KB)
Related Templates


