- Time to Read:
Graphing the data can be utilized for both historical data already available and when analyzing the data resulting from live data collection activities. Of course, you need to pick the right graphical tool as there are a lot of different ways to plot your data. A number of commonly used graphical tools will be covered here. However, note that if one graph fails to reveal anything useful, try another one.
A long list of data is usually not practical for conveying information about a process. One of the best ways to analyze problems in any process is to plot the data and see what it is telling you. This is often recommended as a starting point in any data analysis during the problem-solving process. A wide range of graphical tools are available which can generate graphs quickly and easily such as Minitab and Microsoft Excel.
Different graphs can reveal different characteristics of your data such as the central tendency, the dispersion and the general shape for the distribution. Graphical Analysis allows to quickly learn about the nature of the process, enables clarity of communication and provides focus for further analysis. It is an important tool for understanding sources of variation in the data and thereby helping to better understand the process and where root causes might be. Conclusions drawn from the graphical analysis may require verification through further advanced statistical techniques such as significance testing and experimentation.
Line Charts
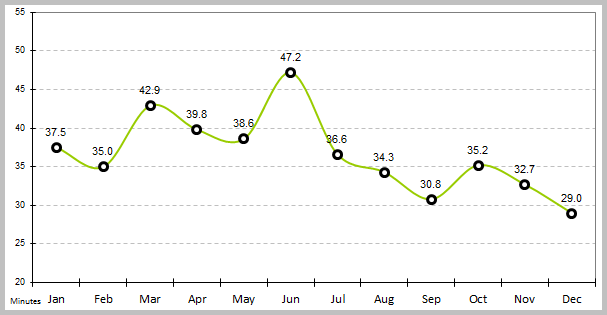
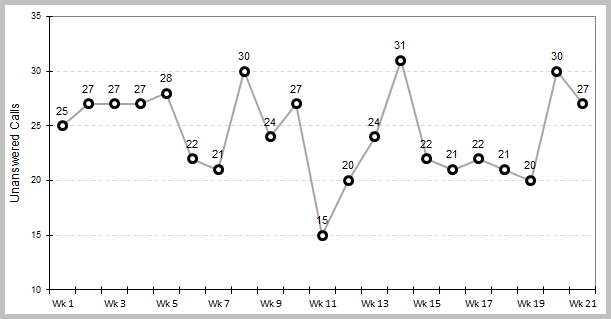
Line Charts are the simplest forms of charts and often used to monitor and track data over time. They are useful for showing trends in quality, cost or other process performance measures. A line chart represents the data by connecting the data points by straight lines to highlight trends in the data. A standard or a goal line may also be drawn to verify actual performance against identified targets. Line charts are the most preferred format to display time series data. Time series plots, run charts, SPC charts and radar charts are all line charts.
Time Series Plots are line charts that are used to evaluate behavior in data over a time interval. They can be used to determine if a process is stable by visually spotting trends, patterns or shift in the data. If any of these are observed, then we can say that the process is probably unstable. More advanced charts for assessing the stability of a process over time are run charts and SPC charts.
A time series plot requires the data to be in the order which actually happened and that the data collection frequency is constant. Time Series Analysis is the analysis of the plotted data in order to get meaningful information out of it. Different behaviors of the data can be observed such as upward and downward trends, shifts in the mean and changes in the amount of variation, patterns and cycles, or anything not random. Time Series Forecasting is the use of a model to predict future values based on previously observed values.
Pie Charts
Pie Charts are ways that make it easy to compare proportions. They are widely used in the business and media worlds for their simplicity and ease of interpretation. They display the proportion of each category relative to the whole data set representing each as a slice of the pie. The percentage represented by each category is usually provided near to the corresponding slice of the pie.
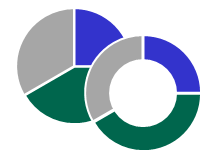
A Doughnut Chart is a variation of the pie chart with a blank center allowing for additional information to be included about the data. Pie and doughnut charts work well with fewer categories and are suitable for presenting data for around seven groups or fewer. A pie chart with one or more categories separated from the rest of the chart is known as an exploded pie chart.
Bar Charts
Bar charts are ways of displaying frequency of occurrence of attribute data. They focus on the absolute value of the data while a pie chart focuses on the relative value of the data. The bar height indicates the number of times a particular characteristic was observed. The bars on the chart may be arranged in any order and are presented either horizontally or vertically to show comparisons among categories. When a bar chart presents the categories in descending order of frequency, this is called a Pareto Chart.
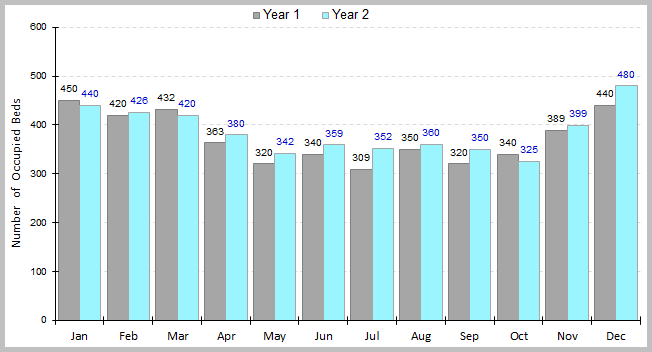
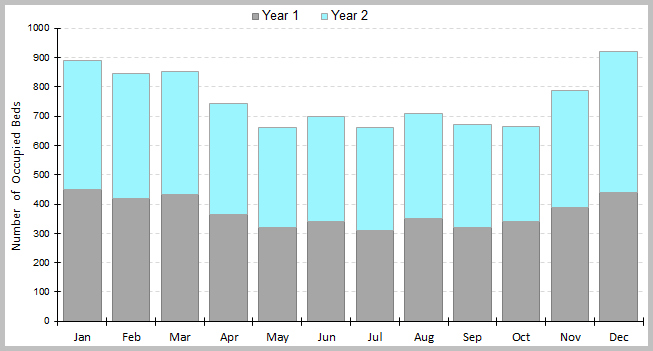
Some bar charts display bars clustered in groups, and these are called Grouped Bar Charts. Other bar charts stack bars of each group on top of each other to show the cumulative effect, and these are called Stacked Bar Charts. A 100% Staked Bar Chart is used for comparing proportions of categorical data and are useful for demonstrating the difference in proportion between categories.
Dotplot
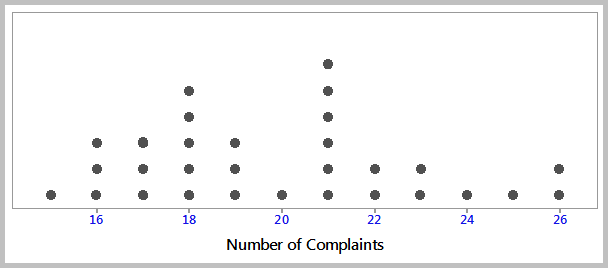
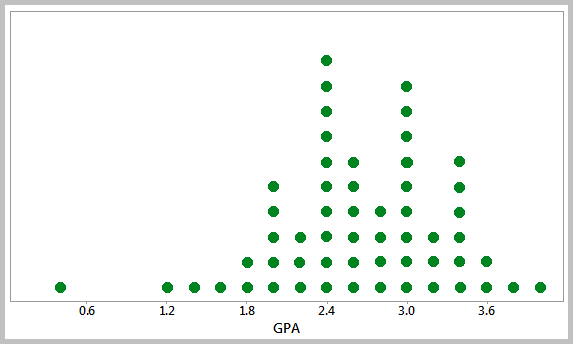
A Dotplot is a graphical representation of data using dots plotted on a simple scale. It is a form of frequency distribution that is suitable for displaying small to moderate data sets when the values are not spread out very much. The X-axis in a dotplot is divided into many small intervals called bins, and data values falling within each bin are represented by dots (one or more dots per data point). The end result is a set of vertical lines of evenly-spaced dots.
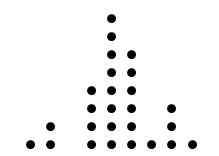
A dotplot is generally used when the data is discrete, however, it can also be used to present continuous data. It shows where the data are clustered, where the gaps are located and can help identify outliers. Dotplots are also useful for comparing distributions in terms of their shape, location and spread.
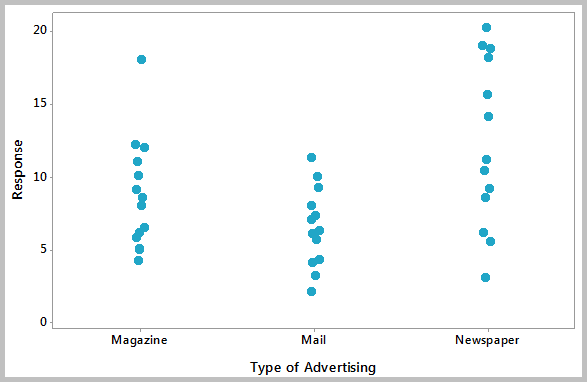
Individual Value Plots
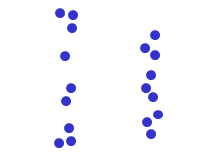
Individual Value Plots are graphs that are useful to give an overall picture of the individual values that make up a data set. They are often used for comparing distributions that have small number of data. This tool enables to see all the values of a data set even if there are similar data points. By plotting individual values of a data set, it would be easy to get an idea of the distribution shapes and whether outliers are present.
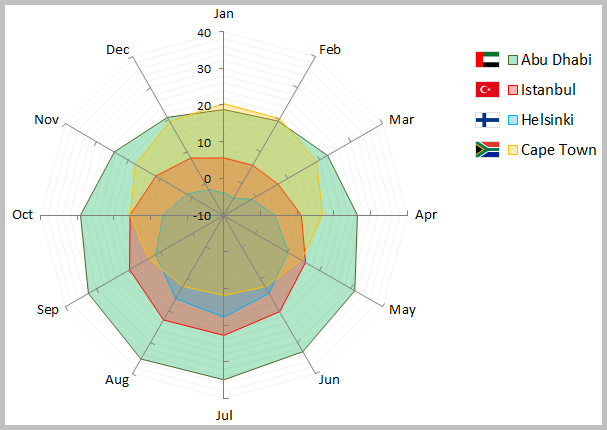
Radar Charts
A Radar Chart is a graphical method of displaying and comparing multiple data sets over a range of characteristics or over a specific period of time. It comes in the form of a two-dimensional chart and has a radial axis and an angular axis. After plotting the data, a point close to the center indicates a low value and a point near the edge indicates a high value. A line is normally drawn connecting the data values for each data set. Radar charts can be useful when comparing between two or more products over a range of characteristics and when analyzing the skills of an employee or a group of employees.
Multi-Vari Charts
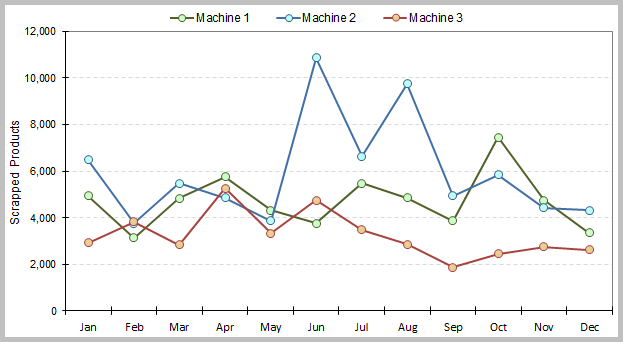
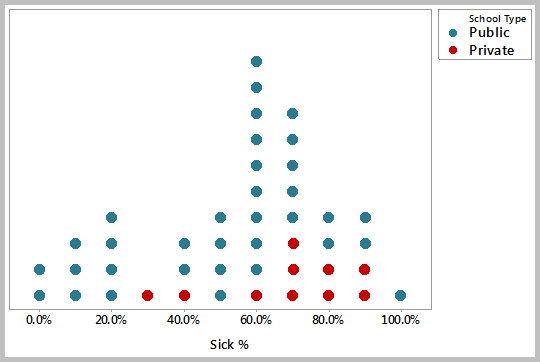
Variation in the data can come from multiple sources. A Multi-Vari Chart is a graphical tool that allows to visually show where the major variation in a data set is coming from. It is called a multi-vari chart because multiple variables are normally plotted together on a single chart. Multi-vari charts are often used when studying the variation within a subgroup, between subgroups, or over time.
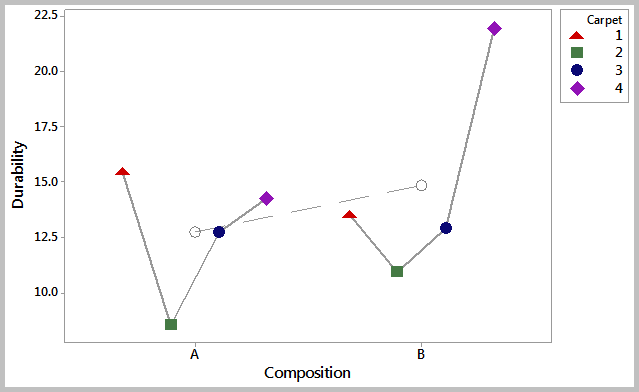
The above chart shows the results of a data set that belongs to Minitab Inc.
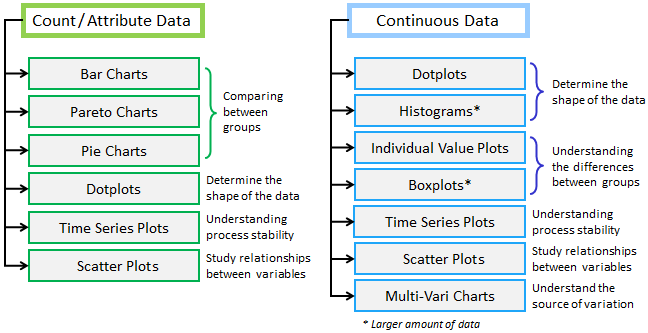
Graph Selection
The graphs you choose depends on the type of data you have and the objective you are trying to achieve. There are graphs for continuous data and graphs for count and attribute data. The following illustration can help you choose the right graph to assess your data set. Remember however that you need to perform additional statistical analysis before drawing any conclusion.