Blog
-
Normality Testing in Minitab
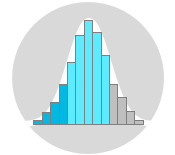
The Normal Distribution is the commonest and the most useful continuous probability distribution. Many statistical tests require that the distribution is normal or nearly normal. Several tools are available to assess the normality of data including: using a histogram to visually explore the data,…

-
Probability Distributions in Minitab
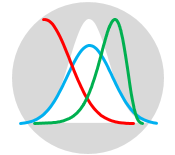
There are different shapes, models and classifications of probability distributions including the ones discussed in the probability distributions article. It is always a good practice to know the distribution of your data before proceeding with your analysis. Once you find the appropriate model, you…
-
Normal Distribution
Continuous distributions describe variables that take values from a continuous range and can be measured with any degree of accuracy. The commonest and the most useful continuous distribution is the normal distribution. The Normal Distribution is a symmetrical probability distribution where most results are…
-
Probability Distributions
Most improvement projects and scientific research studies are conducted with sample data rather than with data from an entire population. A Probability Distribution is a way to shape the sample data to make predictions and draw conclusions about an entire population. It refers to…
-
Descriptive Statistics in Minitab
Minitab is a statistical software that allows you to enter your data to perform a wide range of statistical analyses on that data. It can be used to calculate many types of descriptive statistics including the ones discussed in the Descriptive Statistics article which…
-
Descriptive Statistics
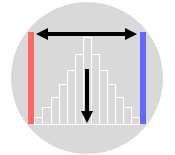
Descriptive statistics are methods of describing the characteristics of a data set. It includes calculating things such as the average of the data, its spread and the shape it produces. It involves describing, summarizing and organizing the data so it can be easily understood.…
-
How RACI Matrix Streamlines Stakeholder Engagement
Also known as Role Matrix, RACI Chart and ARCI Matrix. Related topics include Responsibility Assignment Matrix, Linear Responsibility Chart, and RASCI. When multiple individuals collaborate on a particular project for example, it is easy to assume that someone else is taking care of an…
-
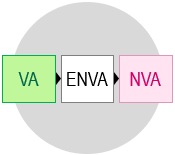
The Concept of Lean Value Analysis
Also known as VA NVA Analysis and Value-Added Analysis. Related topics include Waste Analysis. Oftentimes, we tend to create additional steps to a process in order to fix a problem or enhance a situation. Over time, these additional activities become an established part of…
-
The Concept of Lean Waste Analysis
Also known as the Eight Wastes and the Eight Deadly Wastes and the Eight Forms of Waste. Related topics include Value Analysis. Within a Lean culture, waste is anything that doesn’t add value from the customer’s perspective. It includes activities that consume resources, increase…

-
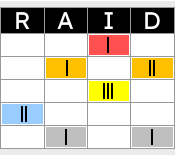
RAID Log Template
A RAID log is a project management tool that is used to store several project information in one place. It allows project managers to track Risks, Assumptions, Issues and Dependencies, making it a useful document in regular project meetings and when conducting audits.
-
Risk Analysis
Risk analysis is a process that helps identify and assess potential threats that could affect the success of a business or project. It allows to examine the risks and includes means to measure, mitigate and control them effectively. It is part of the larger…

-
Applying the PDCA Cycle: A Blueprint for Continuous Improvement
Also known as Shewhart Cycle and Deming Wheel. Related topics include PDSA Cycle and OPDCA. The Plan-Do-Check-Act Cycle (PDCA Cycle) is a four-step model for systematic problem solving and continuous improvement. It offers a simple and structured way for resolving business-related issues and creating…