Blog
-
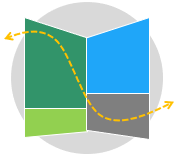
Value Stream Mapping: A Visual Approach to Process Optimization
Also known as Material and Information Flow Analysis and Value Stream Analysis. A Value Stream Map (VSM) is a high-level visual representation of a business process. It helps to understand the flow of value through the process as perceived by the customer. The primary…
-
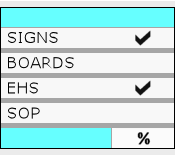
Visual Management Audit Checklist
Visual Management is a technique that uses information displays, visual controls, labels and signs, color coding and other markings instead of written instructions. This checklist serves as a tool to pinpoint and address compliance gaps within your workplace. An effective audit should end up…
-
Process Chart Template
A process chart is a visual representation showing the sequence of activities within a process. This type of process map is preferable when documenting sequential processes that contain few decision points. This template allows to record the steps of any given process in a…
-
The Role of Fishbone Diagram in Analyzing Cause and Effect
Also known as Ishikawa Diagram, Cause and Effect Diagram and Fishbone Analysis. Related topics include Tree Diagram. A fishbone diagram is one of the various techniques available for conducting cause-and-effect analyses. It provides a structured way to identify and organize the potential causes contributing…

-
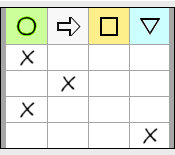
Putting Prioritization Matrix into Practice for Effective Decision-Making
Also known as Decision Matrix, Multiple Criteria Decision Analysis and Weighted Criteria Matrix. Related topics include Pugh Matrix and Pairwise Comparison Matrix. Many real-life decision-making situations have several conflicting criteria that need to be considered simultaneously. Traditionally, these complexities are often dealt with through…

-
Project Charter Components: The Power of the One-Page Document
Also known as Project Summary, Project Initiation Document, and Project Definition Report. Related topics include Project Statement of Work and Terms of Reference. Once a project opportunity has been identified, it must be translated from a conceptual idea into a well-written project charter. A…

-
The Main Components of an Effective Visual Management System
Also known as Visual Control. Visual Workplace, Visual Systems and Visual Factory. Visual management is a business management approach that communicates important information in a visual and real-time manner. It is a system of labels, signs, markings, information displays, and visual guides instead of…

-
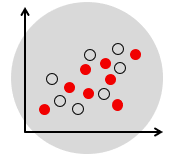
Exploring Variable Relationships with Scatter Diagram Analysis
Also known as Scatter Plot and Scattergram. Related topics include Matrix Plot. Many situations require the investigating of potential relationships among two or more variables. For example, a line manager may wish to assess the correlation between the number of training hours and employee…
-
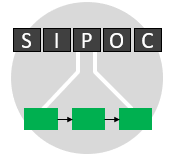
SIPOC Analysis: An Important Step Toward Process Improvement
Also known as SIPOC mapping, COPIS and System Analysis. Related topics include IPO. A SIPOC Map is a comprehensive overview of a business process. It provides a high-level summary and a big picture view of the key components of the process to understand the…
-
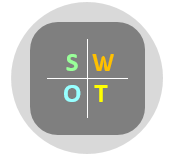
Achieving Business and Personal Goals with SWOT Analysis
Also known as Situational Analysis and TOWS. Related topics include Porter’s Five Forces Analysis and 5C Analysis. SWOT analysis is a structured planning tool used to review and assess an organization’s current position and overall health. This analytical framework enables the organization to look…
-
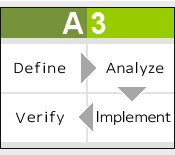
A3 Problem Solving Template
A3 thinking is a logical and structured approach to problem solving adopted by Lean organizations around the world. It can be used for most kinds of problems and in any part of the business. This template uses a four stages model that is based…
-
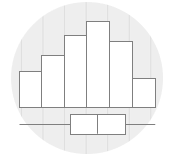
Exploring Histograms and Box Plots: Similarities and Differences
Histograms and box plots are graphical representations for the frequency of numeric data values. These visual tools serve the purpose of describing the data and exploring the central tendency and variability before using advanced statistical analysis techniques. In this article, we will further discuss the…