- Time to Read:
Also known as VA NVA Analysis and Value-Added Analysis.
Related topics include Waste Analysis.
Oftentimes, we tend to create additional steps to a process in order to fix a problem or enhance a situation. Over time, these additional activities become an established part of the process although they do not add any value to the product or service. To improve our processes, it is essential to identify these non-value-added activities, determine the problems they were intended to solve, and then find new ways to avoid these problems in the first place. Problem solving efforts should focus on those aspects of the process that are wasteful and add no value to the customer.
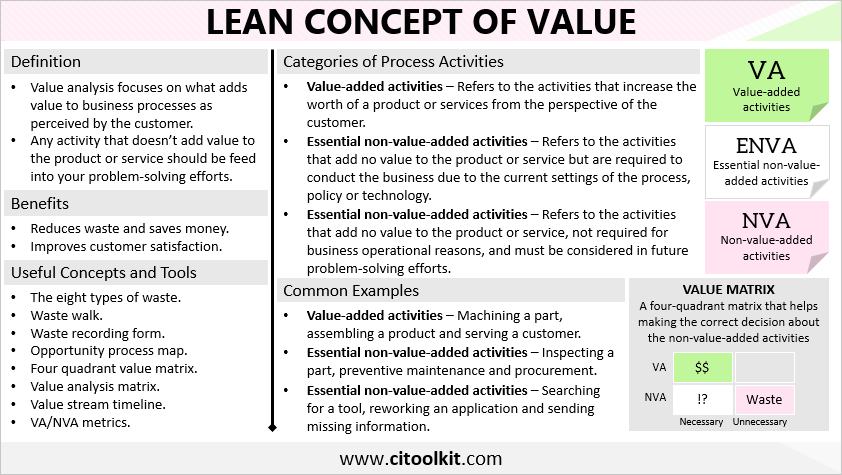
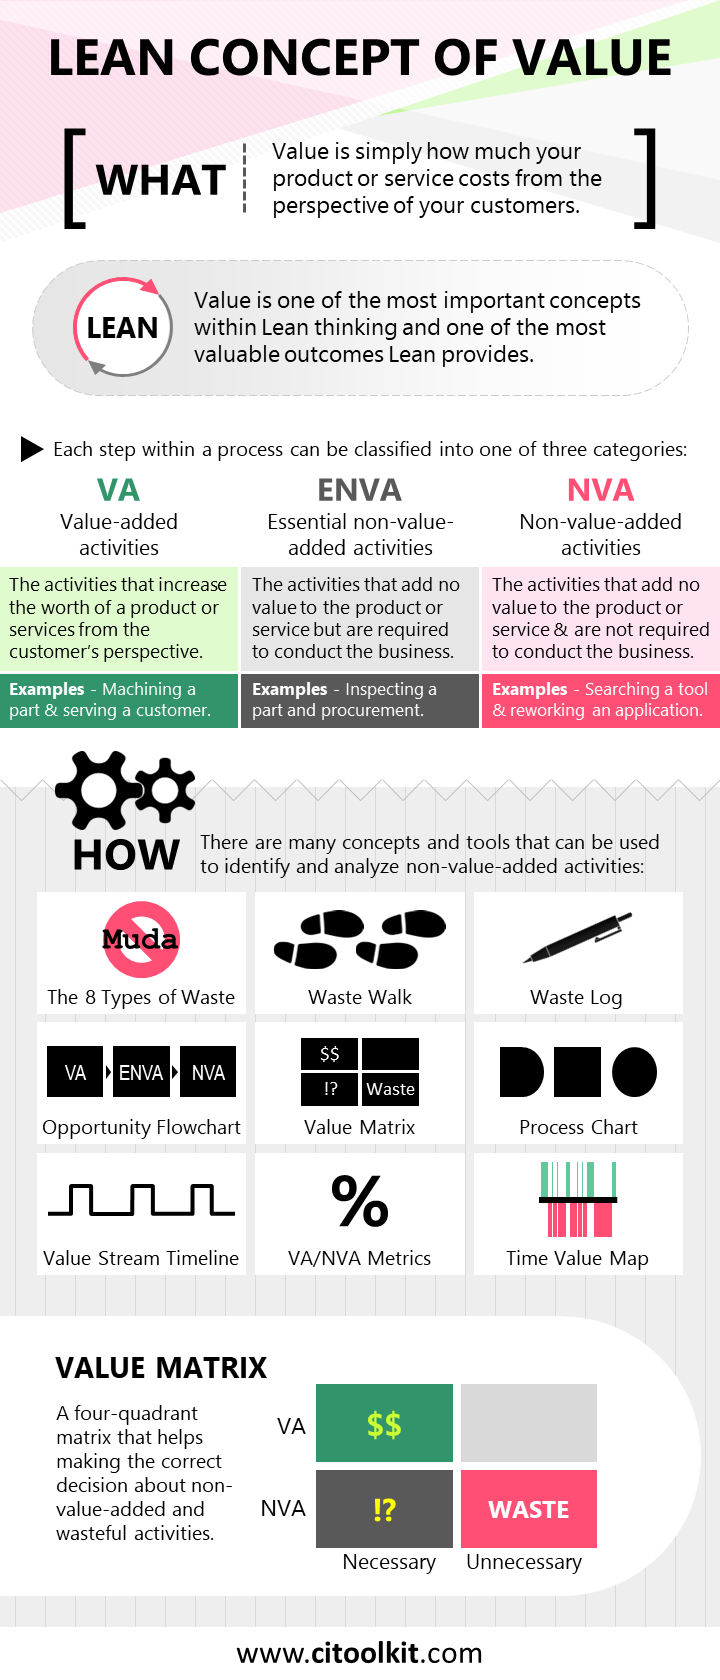
Value is one of the most important concepts within Lean thinking and one of the most valuable outcomes Lean provides. It’s simply the cost of your product or service from the perspective of your customers. Value analysis focuses on what adds value to business processes as perceived by the customer. Any activity that fails to enhance the product or service’s value should be incorporated into future problem-solving efforts.
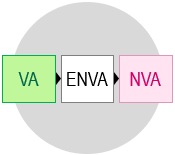
Each step within a process can be classified into one of three distinct categories:
Value-added activities – Refers to the activities that increase the worth of a product or service from the customer’s perspective. Common examples include machining a part and serving a customer.
Essential non-value-added activities – These activities do not add value that customers are willing to pay for. However, they are necessary due to current process settings. Common examples include inspecting a part and preventive maintenance.
Essential non-value-added activities – These activities do not provide any value to the product or service and are not required for business operational reasons. Common examples include searching for a tool and reworking an application.
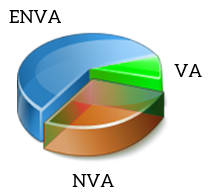
Extensive research has demonstrated that value-added activities typically account for less than 10 percent of the overall work performed in a typical process. This means that the portion of work that truly matters to the customer is a only 10 percent. In reality, companies are spending a significant amount of time and resources on areas that fail to add value.
An example of a value-added activity is painting. However, if repainting becomes necessary due to the use of incorrect paint, it becomes a non-value-added activity, categorized as rework. Customers are not willing to pay for the mistakes of their suppliers.
The first step when analyzing the value of any process is to determine the ultimate customer. The ultimate customer typically refers to the end user of the product or service. It is important that you clearly understand the expectations of your ultimate customers and know exactly what they are willing to pay for. Actively listening to their feedback and encouraging them to provide insights regarding how well your product or service meets their requirements will guide future process improvements.
The following concepts and tools can be used to identify and analyze wasteful and non-value-added activities:
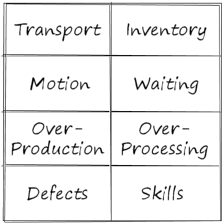
1. The Eight Types of Waste
One of the fundamental principles of Lean thinking involves categorizing waste into eight distinct forms. Click here for further information on the eight types of waste.
2. Waste Walk
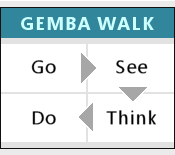
Waste walk is a practical approach that helps in the identification of value-added and non-value-added activities within a specific area or process. By gaining understanding of how the process really works, participants can identify opportunities for continuous improvement. It is highly recommended to regularly walk the process and look for opportunities to reduce waste and enhance process efficiency to drive organizational excellence.
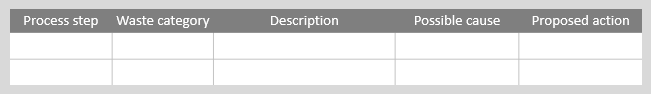
3. Waste Recording Form
Using the waste recording form helps identifying and documenting wasteful activities encountered during waste walks. Typically, this form includes sections to classify waste according to the eight types of waste or any other applicable waste classification framework.
4. Opportunity Process Map
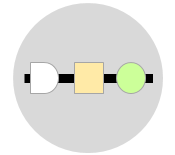
An opportunity process map is a type of process map that provides a visual representation of how the process works and whether activities are value-added or non-value added. Click here for further information on the opportunity process maps
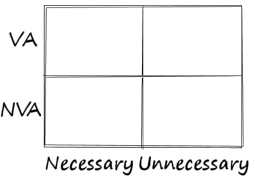
5. VA-NVA Quadrant Diagram
This four-fields matrix serves as a valuable tool in making informed decision regarding wasteful and non-value-added activities. If the activity is unnecessary to the business and adds no value to the product or service, then it should be eliminated or reduced to the greatest extent possible. Click here to see an example.
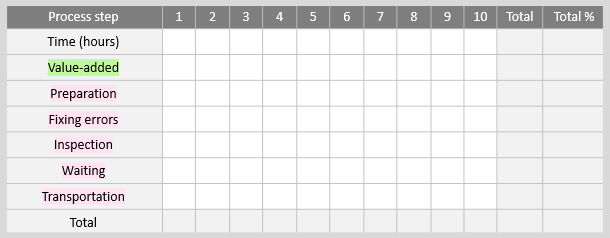
6. Value Analysis Matrix
A value analysis matrix clarifies the various types of non-value-added activities present in the process and can be used to track non-value-added time spent on such activities. Process charts can also be used for the same purpose.
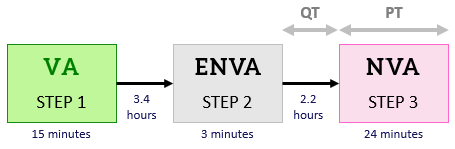
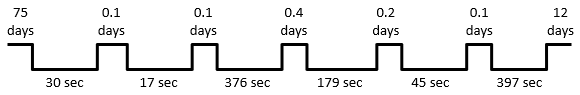
7. Value Stream Timeline
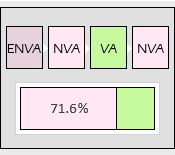
A value stream timeline reflects the value-added and the non-value-added activities within the core process, typically positioned at the bottom of value stream maps. This timeline serves as a means to identify the percentages of value-added and non-value-added activities.
8. VA/NVA Metrics
Many companies are using various metrics in order to measure the performance of their end-to-end process. One of the most common metrics is the Value-Added Ratio (also known as the Value Stream Ratio), which is the proportion of time spent in a process in a way that is adding value.
VAR = Total Value-Added Time / Total Lead Time
There are many tools available to support analyzing the value of a process. One of the simplest and most practical approaches is to use this value analysis template.
Wrapping Up
In summary, many business processes waste time and resources on non-value-added activities. To improve any process, focus on eliminating those activities that don’t benefit or add value to the customer. Understand your customer’s needs, gather their feedback, and streamline the process through ongoing elimination or reduction of unnecessary process activities.
Other Formats
Do you want to use the slides in your training courses?
Value Analysis Training Material: $15.85
Related Articles
Related Templates


