
- Time to Read:
Also known as Visual Control. Visual Workplace, Visual Systems and Visual Factory.
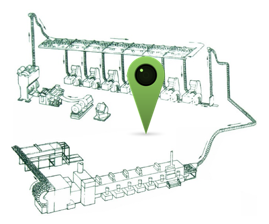
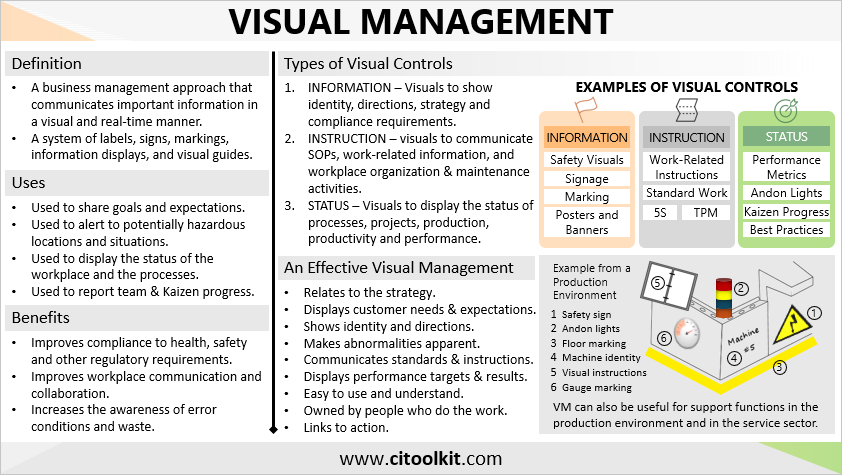
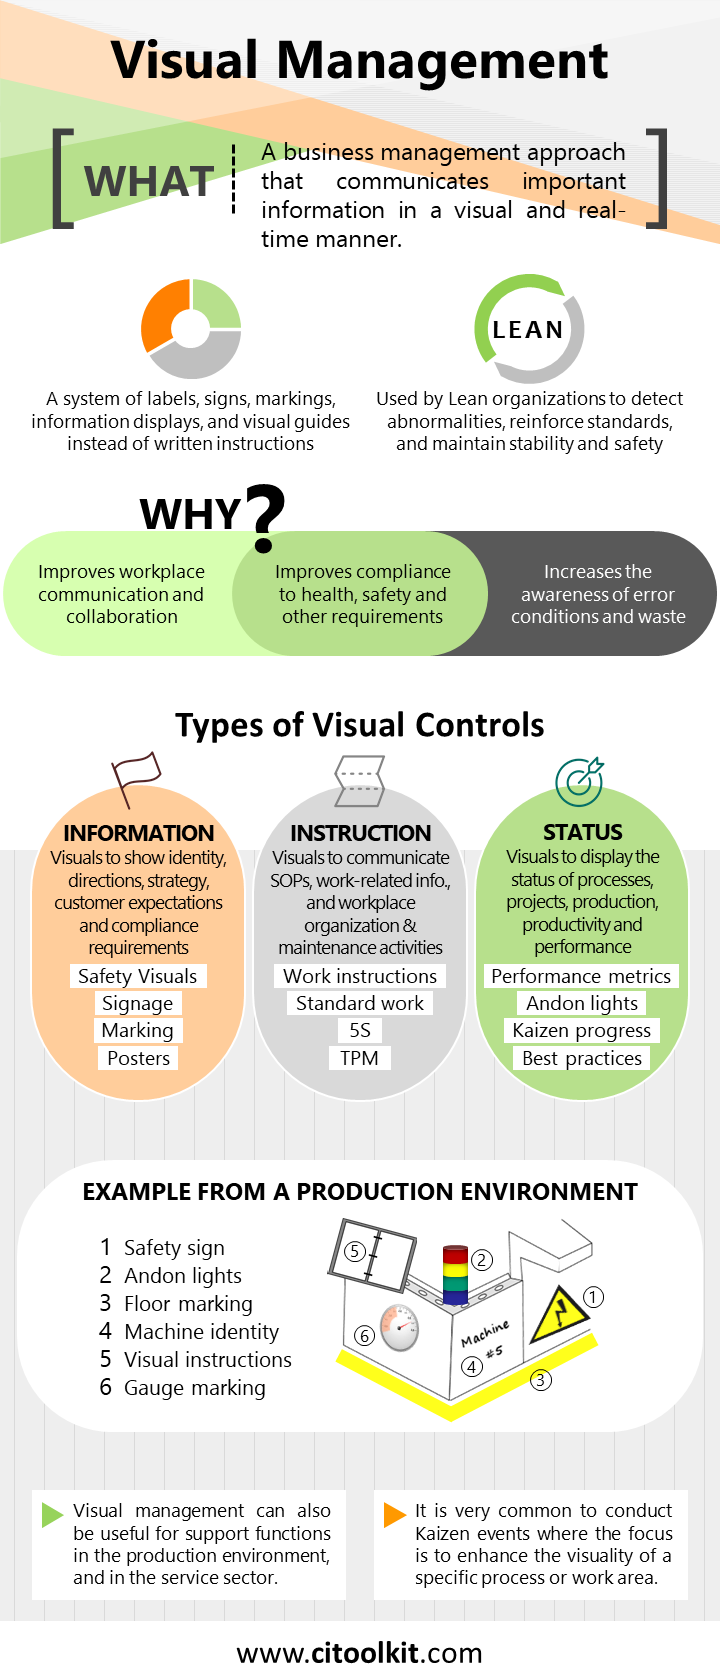
Visual management is a business management approach that communicates important information in a visual and real-time manner. It is a system of labels, signs, markings, information displays, and visual guides instead of written instructions. Lean organizations rely significantly on visual management to detect abnormalities, reinforce standards, and ensure stability and safety are maintained in the workplace. Visual management is particularly important during the early phase of Lean implementation.
A good illustration that demonstrates the power of visual management is found in road signs, traffic lights, and lane markers on the road. The messages they convey are so clear that when you see a traffic light for example, you know exactly what you should be doing. Research has consistently demonstrated that people tend to learn and process information more effectively when presented visually. Our brains inherently respond with greater speed and accuracy to colors, shapes, patterns, graphics, and pictures. Just as road signs are easier to understand than written signs, workplace visuals are easier to understand than written instructions. Therefore, incorporating effective workplace visuals can yield positive impacts on safety, productivity, quality, and on-time delivery.
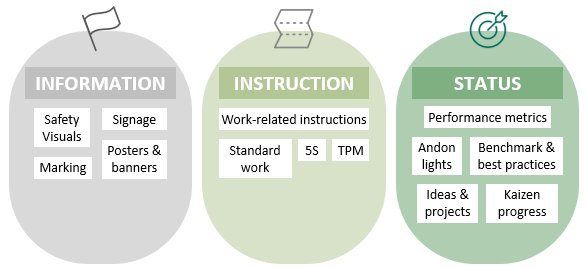
Visual management includes a wide range of visual controls that help making all workplace elements and processes more visually apparent. These visual controls can be:
- Informative to show identity, directions, strategic goals, customer expectations and compliance requirements.
- Instructional to communicate SOPs, work-related information, and workplace organization and maintenance activities.
- Result-oriented to display the status of processes, projects, production, productivity and performance.
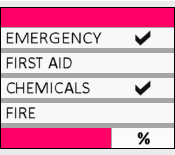
Safety Visuals
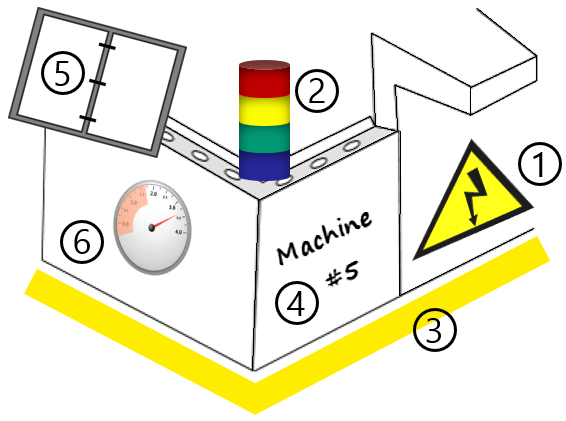
Safety visuals are important for maintaining a secure and environmentally friendly facility. They play an important role in reducing injuries, incidents, near-misses and occupational diseases by addressing unsafe behaviors and conditions. Safety signs and markings often use bright colors to effectively capture attention. It’s important to properly identify the locations of fire protection equipment, safety showers, eye wash stations, personal protective equipment, and first aid stations.
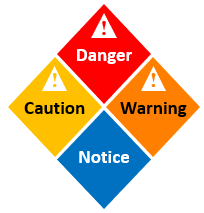
Signage
There are many types of signage that can be used within your facility. For instance, wayfinding and directional signage assist individuals in navigating and directing them from one point to another. On the other hand, warning signs serve to alert individuals about specific activities, such as “do not enter” and “no-smoking” signs.
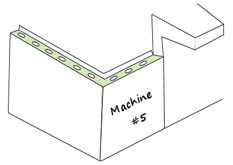
Marking
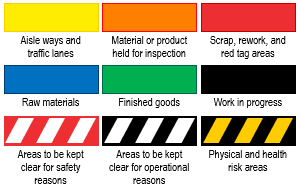
Proper marking of the different elements in the workplace is important to avoid mistakes and enhance efficiency and safety. This involves marking of machines and production lines, marking of materials and finished goods, marking of offices, rooms, work cells and storage areas, marking of emergency lanes and exit routes, and marking of floors and pipelines.
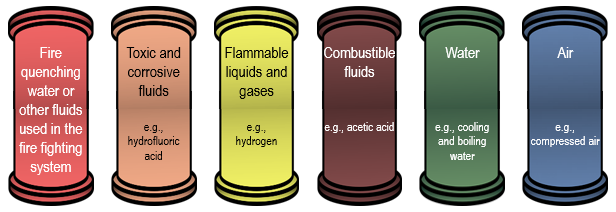
Floor marking is used to improve the layout of the workplace and mark critical safety and security areas. Pipe marking, on the other hand, communicates vital information about pipelines, including their contents, direction, and flow rate. Arrows are used to indicate flow direction, while colors often indicate the nature of the contents. Additionally, labels may be affixed to pipelines to provide more descriptive information.
Posters and Banners
Using of posters and banners can reinforce business goals and values, promoting awareness of safety and well-being among employees.
Work-Related Instructions and Standard Work
A robust visual management system aims to promote consistency and establish process stability. Standard work visuals serve to minimize production errors and ensure activities are always performed by all in the most efficient and effective manner. Visuals, such as work-related instructions, process specifications, flowcharts, and standard operating procedures should be prominently displayed at each machine or workstation, ensuring easy visibility for all.
Visual controls are frequently used in conjunction with color standards to enhance clarity and facilitate workplace communication. It is worth noting that the most effective visuals often incorporate photographs and illustrations, and are positioned at the points where they are most needed.
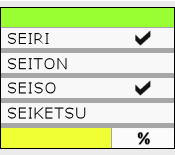
5S
The 5S methodology involves many visual management practices that contribute to a more organized workplace. For example, the second step of the 5S methodology, known as ‘set-in-order’, promotes the use of colors and labels to clearly mark storage locations. Additionally, 5S promotes the utilization of many inventory management techniques for defining inventory levels and reorder triggers. Displaying photographs illustrating the desired organization of an area serves as another example of using visual management to enhance workplace organization.
TPM
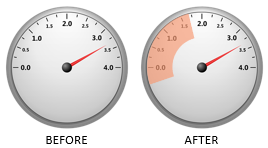
Total productive maintenance visuals can be highly effective in identifying and preventing abnormalities from turning into failures. Marking gauges, oil levels and lube points are examples of visual controls that enable employees to easily detect abnormalities and out-of-specification conditions. If something is not normal, we want to make that as apparent as possible. Another example is using colored sleeves to differentiate tools within specific kits, teams, or areas, thereby reducing the time spent looking for lost or misplaced tools.
Area Information Boards
An area information board serves as a tool for communicating operational updates to ensure consistent awareness among all employees. Conducting daily meetings in front of these boards facilitates discussions on previous day’s issues and enables planning for upcoming activities. These stand-up meetings are particularly valuable to facilitate handovers in multi-shift operations. All aspects of an operation can be addressed during these meetings, hence, information on boards should be fresh and up-to-date in order for the meetings to be effective.
Area information boards should be strategically positioned in a central location and easily visible to all. They serve as platforms for displaying various types of information, including but not limited to:
- Performance metrics.
- Benchmark information, best practices, and lessons learned.
- The status of improvement projects.
- Kaizen progress and teamwork activities.
- Operational records.
- Other informative information such as announcements, news, events, process maps, policy changes, etc.
Performance Metrics
A workplace without a display of performance metrics is like a car without a speedometer. You may know where you are going but you have no idea when you will reach your destination. Performance metrics should be displayed in a visually appealing manner, allowing individuals to gain insights into the operation’s performance. Performance information should be meaningful, easy to understand, free of technical terms, accurate and kept up to date.
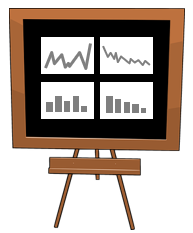
Real-time visual dashboards are used to improve production control. They make it easy to identify error conditions and allow prompt responses to issues that may impact productivity.
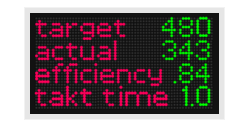
Production summary boards serve as essential tools for monitoring the output of an operation and ensuring alignment with customer demand. These boards should be prominently displayed in the workplace, allowing everyone to see where production stands. This visibility allows production and maintenance teams to quickly address and resolve any process issues that may arise during production.
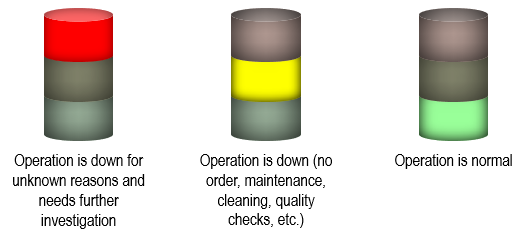
Andon Lights
Andon lights are powerful visual tools installed on production machines to indicate their current status. Since they are visible from a distance, they are very useful in bringing immediate attention to problems as soon as they arise. For instance, these lights may illuminate to signify a shortage of raw materials, awaiting parts, or the need for maintenance. The Andon system can also include means to stop the process, enabling immediate resolution of the identified issue.
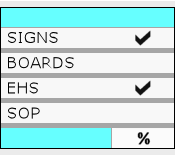
Regular evaluation of the progress and effectiveness of the visual management system is essential. This evaluation can be facilitated through the utilization of a visual management audit checklist, which aids in detecting abnormalities and reinforcing standards and safety measures. By utilizing such a checklist, observers can effectively address compliance gaps and identify opportunities for continuous improvement, hence, an effective audit should end up with a comprehensive list of improvement actions. Furthermore, it is important for top management and supervisors to actively participate in these reviews.
There are many tools that are available to facilitate the auditing of visual controls. One of the simplest and straightforward approaches is to use this visual management audit checklist.
Kamishibai Board
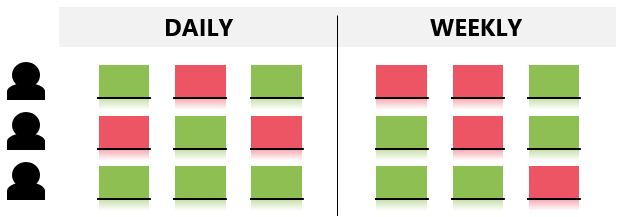
The Kamishibai board is a visual management method that is used to oversee routine activities within a workplace. It can be used to audit safety and security measures as well as to confirm that standard work is being undertaken by all employees. A basic Kamishibai board consists of a board and multiple cards that display specific activities to be performed.

Typically, each card is red on one side and green on the other, indicating the completion status of the activity. Flipping over a tag from red to green indicates the fulfillment of the respective task.
Wrapping Up
The aim of visual management is to enable anyone working in the workplace to be able to assess the current situation at a single glance. This should bring the workplace to the point where all problems, abnormalities and waste to be immediately recognized.
When problems and deviations are visible, immediate corrective measures can be implemented, thereby enhancing the efficiency and effectiveness of processes. Moreover, workplace visuals can play an important role in job training, reducing the need for excessive supervision as employees understand the standards, see the results, and know exactly what to do.
Other Formats
Do you want to use the slides in your training courses?
Visual Management Training Material: $25.85
Related Articles

Related Templates


