- Time to Read:
Performance management is an approach used to manage performance of an organization. It can play an important role in the success or failure of a business. It can be applied to measure the performance of an organization, a business unit, a single department, a project, an employee, and even the process to build a product or service. It includes activities that will help to ensure goals are consistently being met in an effective manner. Those activities include planning and setting expectations, developing the capacity to perform, continually monitoring performance, periodically rating performance in a summary fashion, and rewarding good performance.
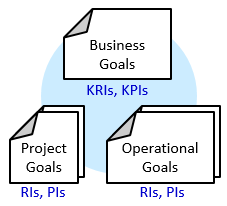
Performance indicators are measurements that define and assess the performance and the success of an organization. They are objectives to be targeted in order to add the most value to a business. They are means to periodically assess the performance of an organization, its departments and the people working there. Performance indicators are developed to impact the entire organization. Accordingly, choosing the right performance indicators relies upon a good understanding of what is important to the organization.
An organization may use performance indicators to assess its success as well as the success of an operational goal or a particular activity. Performance indicators are either result oriented or process oriented. Result oriented indicators focus on the key outputs of a process and related to the critical success factors (e.g. customer complaints from key customers and return on investment). While process oriented indicators focus on the inputs to a process (e.g. time to process customer order and late deliveries to key customers).
An organization may use performance indicators to assess its success as well as the success of an operational goal or a particular activity. Performance indicators are either result oriented or process oriented. Result oriented indicators focus on the key outputs of a process and related to the critical success factors (e.g. customer complaints from key customers and return on investment). While process oriented indicators focus on the inputs to a process (e.g. time to process customer order and late deliveries to key customers).
Selecting the Proper KPIs
Performance indicators are often developed based on the critical success factor. CSFs are the elements that are necessary for a strategy to be successful and for an organization to achieve its mission. CSFs selection is a very subjective exercise and requires active leadership by senior management. Examples of CSFs are: delivery on-time and in-full, providing superior customer service, short time to market new products, management commitment and staff orientation.
For example, if one of your goals is to deliver product on-time in-full, then a performance indicator may be the percentage of deliveries that are received by customers not on-time in-full. By monitoring this, you can improve your delivery performance by directly measure how well your organization is meeting its long-term goal of providing an on-time in-full delivery to customers.
Performance indicators need also to reflect the Voice of the Customer. By understanding the Critical-to-Quality characteristics (CTQs) features of your customer, you can use them as a basis to select your performance indicators. Customer satisfaction level, customer retention rate, the number of key customer visits, and the profitability of customers are among the indicators that may be measured. In order to calculate those performance indicators, raw data needs to be collected from customers.
KPI Tree
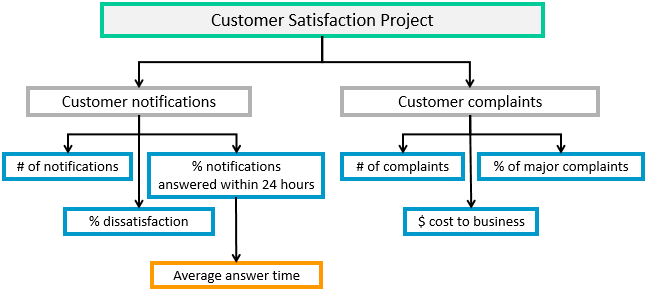
An ideal situation is where performance indicators cascade down through an organization. A KPI Tree is a visual method of displaying a range of measures in an organization or related to a project. This helps people work in such a way that their activities are aligned with the organization strategy, and helps individual work areas contribute to overall business performance. It helps bringing together a range of measures and provides a visual representation for which measures contribute to other measures.
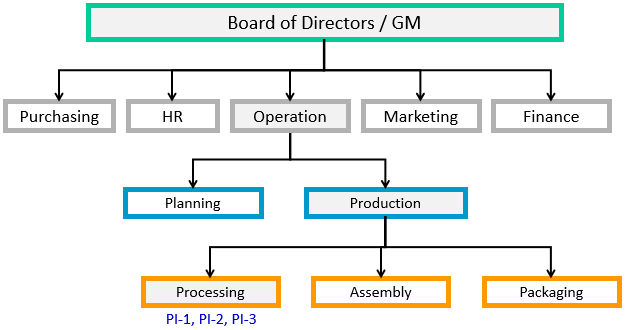
A successful KPI tree is the one that contains a balance of measures covering efficiency, effectiveness, quality, delivery and cost. You might find that sometimes you have to develop some new measures to achieve this balance. Effectiveness performance indicators measure processes in the eyes of the customer. They measure customer satisfaction such as quality, on-time delivery, cost, accuracy, ease of use, etc. Efficiency performance indicators measure processes from business perspective, and are of interest to the internal customers. They measure the amount of resources used by a process and are thus likely to have close links with the 8 Wastes. Examples are: processing time, waiting time, cycle time, inspection cost, repair cost and material usage.
Example
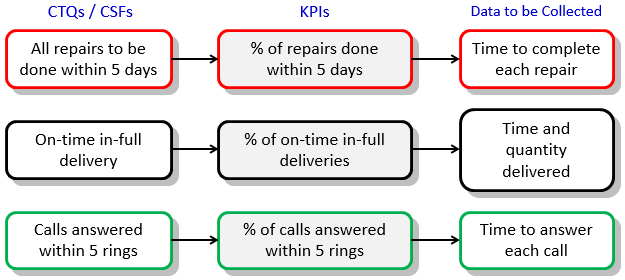
The following is an example of a KPI Tree that was constructed during the implementation of a customer satisfaction research improvement project.
Operational Definition
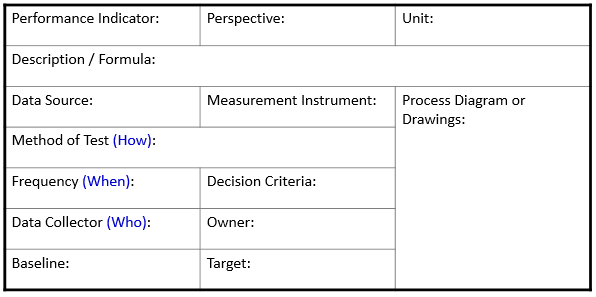
An operational definition is a clear and detailed description of a performance indicator. The need for operational definitions is fundamental when collecting data. The data collection will be meaningless if there is an inconsistency in understanding a measure, a specification, a requirement, or a procedure. Operational definitions ensure consistent data collection, eliminate ambiguity, and ensure standards are applied in the same manner.
The following is an example of a form that can be used to present the operational definitions of performance indicators.
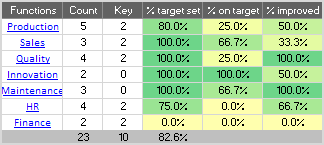
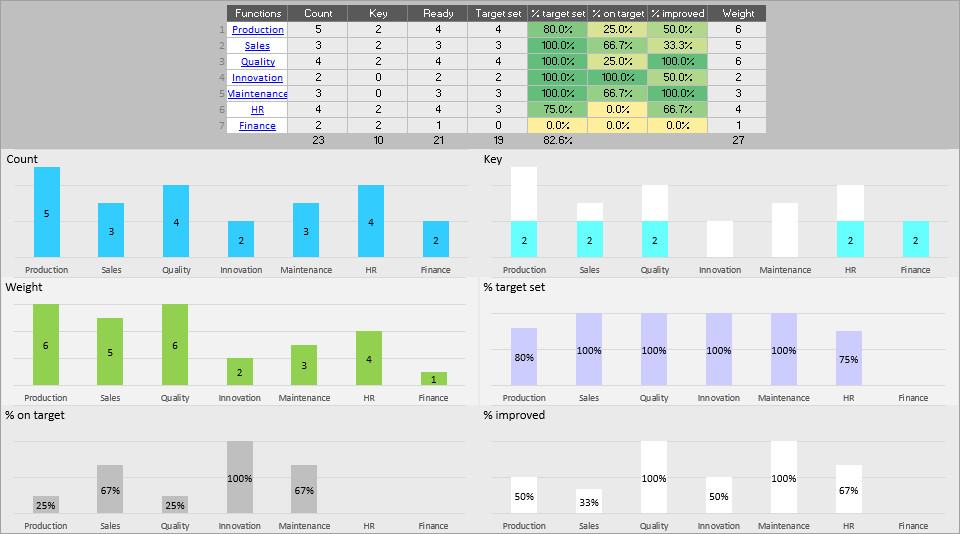
Dashboard Reporting
Performance dashboards are used to easily monitor the performance in an organization. They are often a series of graphics, charts, gauges and other visual tools that can be easily interpreted and analyzed. They allow to see if the performance indicators are being met based on the goals in place. If not, they will visually alert that corrective actions should be made. They are typically limited to show summaries, comparisons and trends.
Common KPIs
Here are some of the common KPIs to measure and monitor per business function:
Manufacturing and Production
- Spoilage / rejection rate
- Re-work rate
- Time spent on product re-work
- Total units manufactured
- Units per day
- Units per labor hour
- Line efficiency
- Production capacity
- Capacity utilization
- First time right ratio
- Rolled throughput yield (RTY)
- Average changeover time
- Material usage
Purchasing and Inventory
- Cancelled purchase requests
- Purchase orders completed
- Purchase order cycle time
- Emergency purchase rate
- Rejected receipt rate
- Late deliveries from suppliers
- Changes in approved suppliers
- Unloading time
- Stock level
- Inventory days coverage
- Re-work on procured inventory
Sales, Marketing and Shipping
- Time to process customer orders
- Time to resolve customer claims
- Visits to key customers
- New customers rate
- Customer retention rate
- Sales forecast accuracy
- Market share growth
- Marketing expenses
- Product availability
- Loading time
- Not on-time in-full (NOTIF)
Finance and Accounting
- Net profit margin
- Cost of goods sold
- Operating income
- Cost per unit
- Working capital
- Accounts receivable turnover
- Inventory turnover ratio
- Return on investment (ROI)
- Budget variance
- Capital expenditure (CAPEX)
- Monthly department expenses
Maintenance
- Response Time to Breakdown
- Mean Time Between Failures
- Mean Time to Repair
- Spare Parts Inventory Turnover
- Work Orders Completed
- Preventive Maintenance Completed
- Repair Cost
- Repair Cost per Unit
- Maintenance / Repair Downtime
Human Resources
- Staff turnover ratio
- Employee satisfaction index
- Exit interview satisfaction ratio
- Internal promotion rate
- Labor utilization rate
- High performing employees
- Training hours ratio
- Training attendance ratio
- Absenteeism rate
- Part-time employees
- Disabled staff ratio
Enviroment, Health and Safety
- Workplace inspection audits
- Risk assessments implemented
- Lost work days
- Significant injury cases
- Near miss cases
- First aid treatment cases
- Environmental incidents
- Safety circles conducted
- Satisfaction with ergonomics
- EHS training hours
Quality
- Customer complaints
- Returns from key customers
- Customer satisfaction index
- Customer surveys conducted
- Defects at customer site
- Defects per million opportunities
- Defects per unit
- Cost of non quality
- Quality circles conducted
- Audits performed on schedule
Lean
- Value added time
- Takt time
- Operator / machine cycle time
- Order processing cycle time
- Net available time
- Work in process time
- Value stream ratio
- Process Cycle efficiency
- Uptime ratio
- Overall equipment effectiveness
- Muda-free cost
KPIs and Continuous Improvement
Performance indicators are key to the continuous improvement process. They are used to establish improvement priorities and track the progress of improvement projects. The following are examples of indicators that are used to measure continuous improvement activities:
- Chartered improvement projects
- Project charters approved and signed off
- SOPs developed after improvement projects
- Completed improvement projects
- Financial department involvement in improvement projects
- Processes perform at 4.5 Sigma or higher
- Staff trained in Lean Six Sigma
- Savings resulting from improvement implemented by employee suggestions
- Time to respond to suggestions
- Idea conversion rate
- Kaizen events conducted
- Cross-industry benchmarking studies conducted


