- Time to Read:
Also known as Traffic Light Rating System.
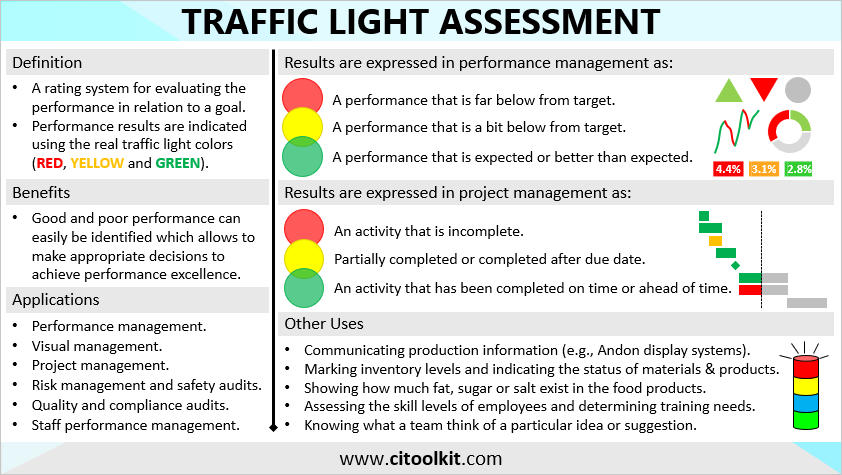
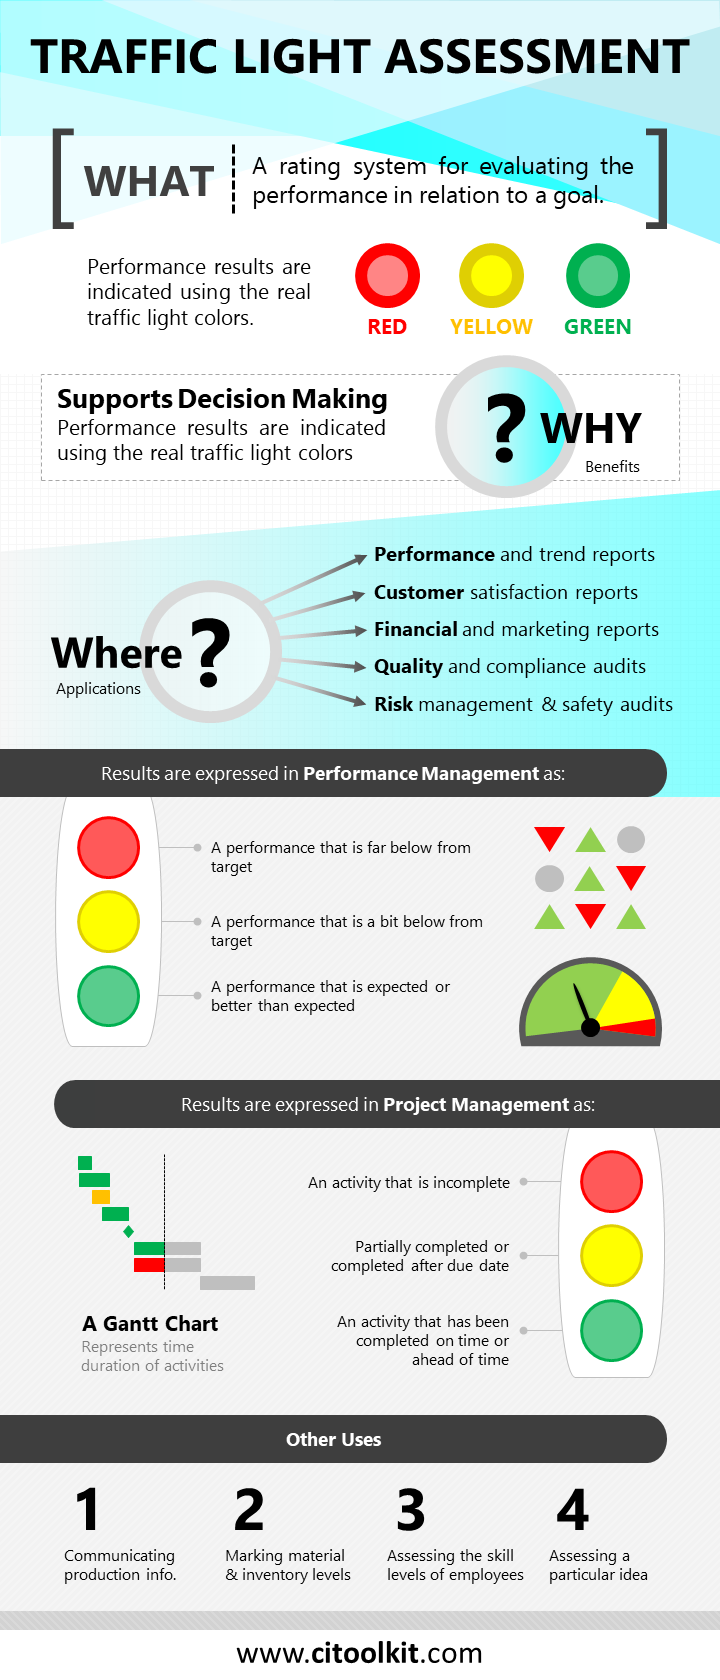
Traffic Light Assessment is a rating system for evaluating the performance in relation to predefined goals. This system facilitates the clear and effective communication of performance metrics, leveraging universally recognized traffic light colors (i.e., red, yellow, and green) to represent performance outcomes. Good and poor performance can easily be identified empowering informed decision-making toward the pursuit of performance excellence. Traffic light systems are widely used in performance management, visual management, and project management.
In Performance Management
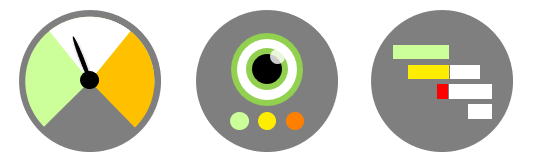
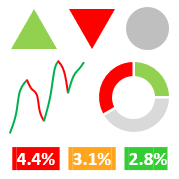
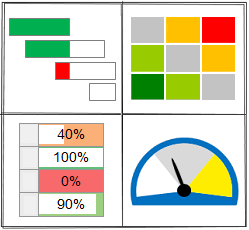
Traffic light assessment plays an important role in presenting performance information to enhance the decision-making process. Results are conveyed through a color-coded scheme, where red indicates performance that is significantly below target, yellow indicates performance slightly below the target, and green indicates performance either meeting or better than target. This color-based approach can be applied to performance indicators, trend indicators, variance indicators, graphical charts and dashboards.
In Visual Management
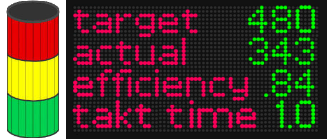
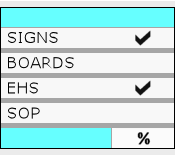
Traffic light assessment is very effective in visual management and widely used in factories, warehouses and workshops. For instance, the Andon light system effectively utilizes traffic light colors to communicate real-time production information on the shop floor. Red indicates a production that has stopped or a line that is down, yellow typically indicates a production that has slowed down, while green conveys smooth production operations. A Kamishibai board is another visual management example that uses traffic light colors to indicate the progress of various activities.
In Project Management
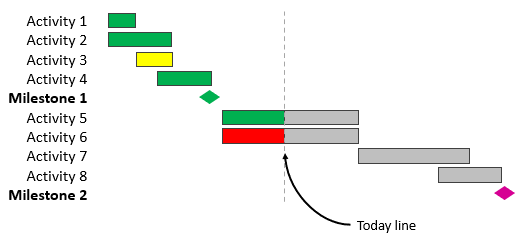
Traffic light assessment is an effective tool in project management and project risk assessment. It indicates how well activities and milestones are being achieved and how on track the overall project is progressing. The color red indicates incomplete activities, yellow typically indicates partially completed or delayed activities, and green indicates activities completed either on schedule or ahead of time. Additional color codes may be employed to convey specific information, such as blue for activities on hold and magenta for newly added or modified activities.
Other Applications
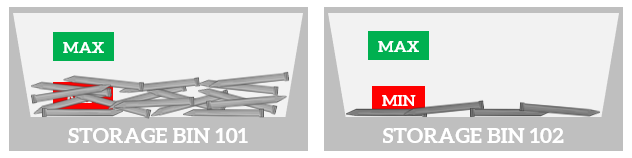
Traffic light assessment concepts can also be used in several other applications, such as presenting the status of a material or product and marking inventory levels and reorder triggers. In the food industry, traffic light labels effectively communicate nutritional information, with red indicating high levels of fat, sugar, or salt, yellow indicating moderate levels, and green indicating low levels. Teams may also use them to assess ideas and suggestions with red indicating inadequate proposals, yellow indicating promising concepts in need of review, and green indicating outstanding ideas.
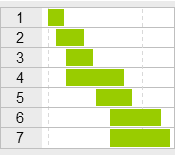
Example – Gantt Chart
This is an example of a Gantt chart that uses the traffic light colors to indicate the status of activities and milestones for a project.
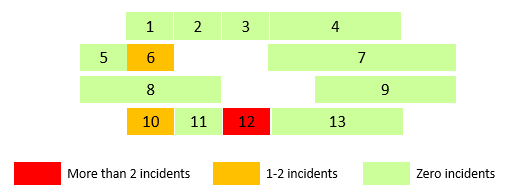
Example – Factory Map
Below is an illustrative map of a factory highlighting the areas which have the most safety incidents that resulted in lost time.
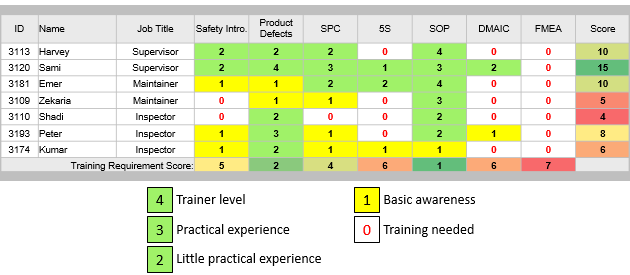
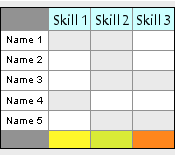
Example – Skills Matrix
The following is an example of a worksheet that uses the traffic light colors to assess the skills of employees and identify training needs within a company.
Wrapping Up
Traffic light assessment is a helpful system that uses traffic light colors to show how well something is doing. It’s commonly used in performance, visual, and project management. In project management, this system aids in assessing activity and milestone achievement, tracking project progress, and managing project risks. It’s also used in various other areas, such as presenting the status of materials, product and inventory levels. In summary, traffic light assessment systems simplify complex data into a format that is easily understood, aiding in better decision-making.
Other Formats
Do you want to use the slides in your training courses?
Traffic Light Assessment Training Material: $15.85
Related Articles


Related Templates
Effective Tools for Business and Life


