- Time to Read:
Also known as Business Process Mapping and Process Modeling.
Related topics include Flowcharting and Value Stream Mapping.
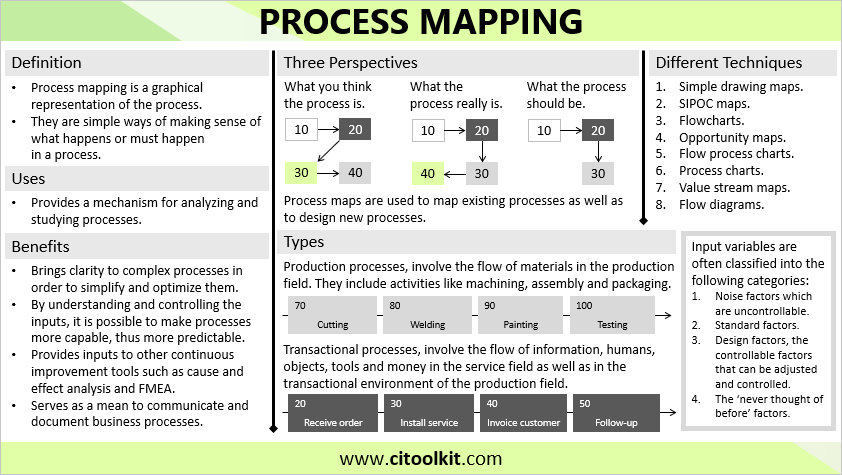
A process map is a graphical representation that illustrates the sequence of activities within a business process. It represents these activities in a step-by-step manner to help understanding how products are manufactured and services are delivered. Process maps are simple ways of making sense of what is happening or should happen in a process. They allow to know how exactly an organization does its work, and how well it is performing relative to its defined objectives.
Process maps provide a mechanism for analyzing and studying any given process and are considered the first step toward process management and process improvement. They are used in mapping existing processes, designing envisioned new processes, and mapping out the future state following process optimization or redesign. Continuous improvement teams are using them frequently to identify variability and non-value-added activities in order to improve the process, thereby improving of the quality of products and services.
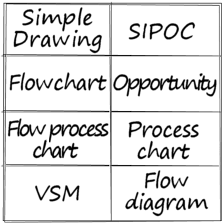
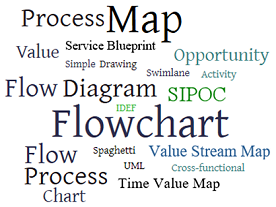
Processes can be mapped and analyzed using different techniques depending on the desired objectives. The following are some of the most common techniques.
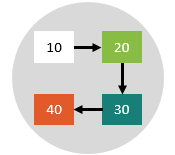
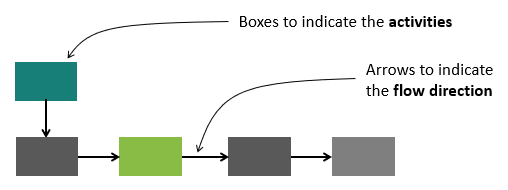
- Simple-drawing process map – The most basic format and contains only boxes and arrows.
- SIPOC map – A high-level process summary.
- Flowchart – Provides a detailed view of the ‘should-be’ process including decision points.
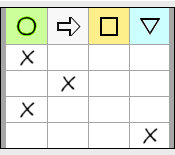
- Process sequence chart – Provides a way to identify the non-value-added activities.
- Value stream maps – Used to identify and prioritize areas for improvement by pinpointing bottlenecks, delays, and other sources of waste.
From this point until the end of the material, we will use the simple-drawing process map technique to illustrate the examples.
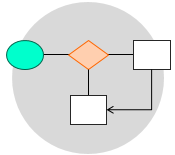
Example – Equipment Installation
The following equipment installation process map is an example that uses the simple-drawing format. Note that additional information can be added to each activity such as timeframes and responsibilities.
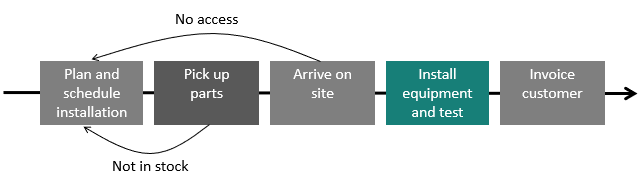
Rework loops can be included in cases where activities are repeated. In this example, there are two such rework loops.
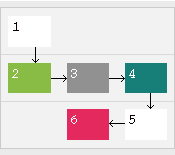
Example – Doing the Laundry
Below is an example of a process map illustrating the steps involved in performing laundry in the old classic manner.
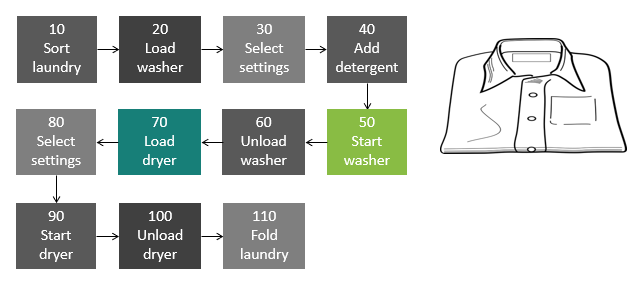
It is sometimes useful to number the process steps, as in this example, to avoid losing track of the flow, especially if the process has many activities.
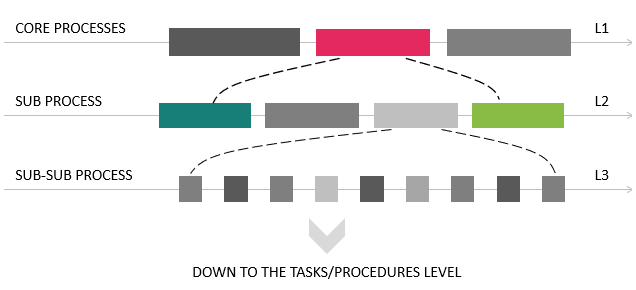
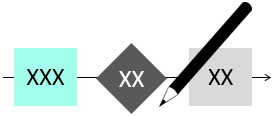
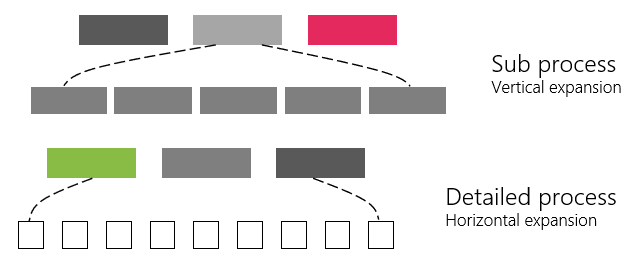
Process maps can describe processes in different levels of details, just like real geographical maps. Each process step can itself be further decomposed into multiple sub-steps, as illustrated below. Additionally, the complexity of the process can be adjusted to match the needs of a particular situation, with the level of detail changing depending on the specific objectives to be achieved.
Example – Making Orange Juice
The following is a process map for making orange juice. This process may be part of a larger process, such as the preparation of breakfast, for instance.
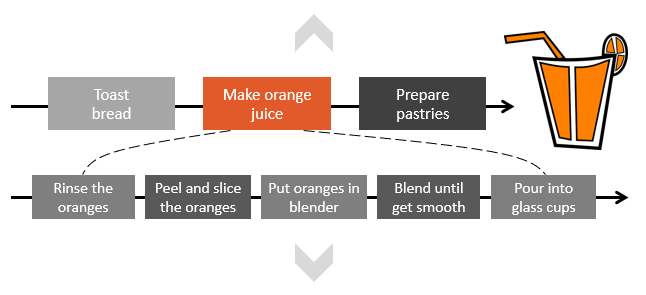
Each of the five process steps can be further decomposed. For example, more elaboration can be made on the process of peeling oranges and the operation of the blender machine. It is important however to work at the level that aligns with the specific context.
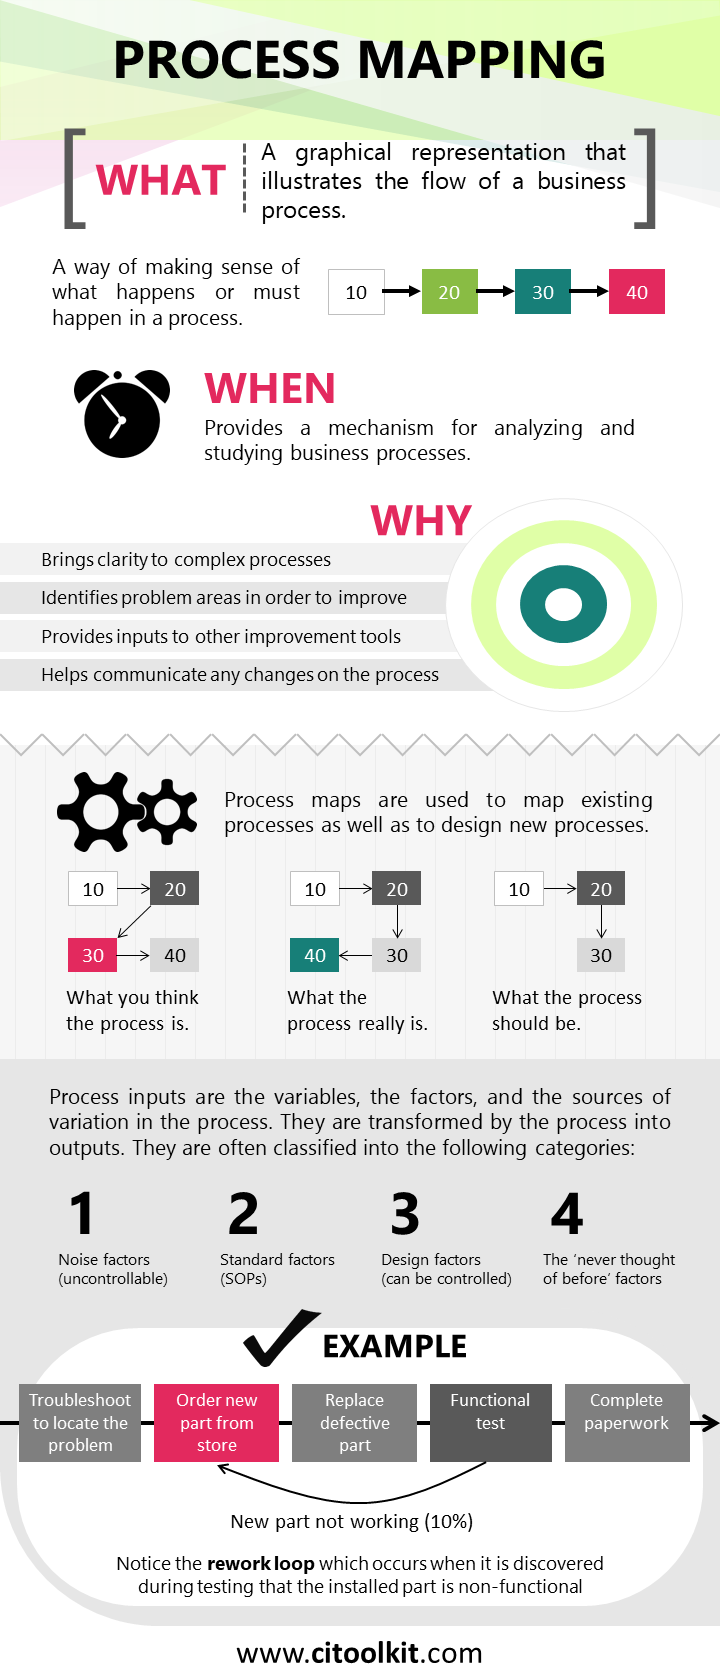
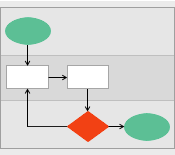
Example – Repairing a Defective Unit
The following is a process map for repairing a defective unit after received by a customer. So far, only one process step has been mapped to a second level.
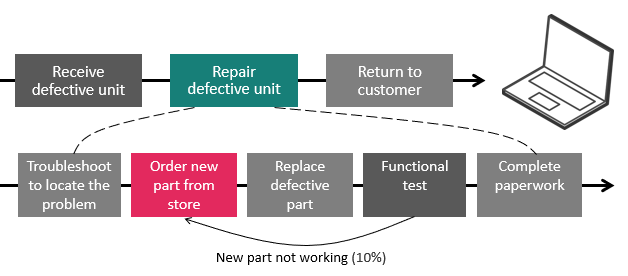
Notice the rework loop which occurs when a non-functional part is discovered during functional testing. Notice also the value ‘10%’, which represents the average proportion of the discovered non-functional parts during testing. This is the key performance indicator that needs to be monitored for the sake of continuous improvement.
One of the main advantages of process maps is that they facilitate the identification of key process input variables responsible for causing significant variability in the process. These variables are often classified into three distinct categories:
- Noise factors (N) – The uncontrollable, costly or preferably not to be controlled factors such as environmental and cultural factors.
- Standard factors (SOP) – The standardized factors according to some operational requirements, regulations or best practices. Examples are safety and preventive maintenance factors.
- Design factors (DF) – The controllable factors that can be adjusted such as the speed of a machine and the ingredients of a recipe.
The classification of input variables will help in focusing on the factors that are controllable. Only the design factors need focused attention when attempting to improve the process.
Example – Making Coffee
The following is an example of a process map that details the steps required for preparing a coffee drink.
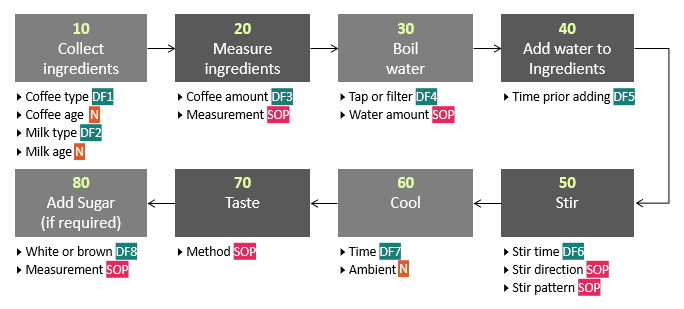
Although there are many possible sources of variation in this process, only eight controllable factors can be adjusted to influence the quality and flavor of the coffee.
Constructing a Process Map
Process maps are easy to understand and simple to construct through the following steps:
- Gather the team and make sure that everyone is clear on the process that is going to be mapped.
- Agree on the mapping technique to be used, on the appropriate scope and boundaries, and on the level of detail.
- Generate the ‘As-Is’ process map by identifying all the current activities and their sequence of completion.
- Add further details as necessary, and classify the input variables as Design, Noise or SOP.
- Once the process is mapped, analyze it to identify problem areas and improvement opportunities. Identify all the areas that hinder the process or add little or no value.
- Build the ‘Should-Be’ process map.
- Implement actions to reduce variability and improve the process.
There are many tools that can help in the creation of process maps. One of the simplest and most straightforward options is to use this process map template.
Wrapping Up
A process map enhances the understanding of any given process. It helps making complex processes clearer, thereby enabling simplification, streamlining, and optimization. It serves as a diagnostic tool for identifying issues like bottlenecks, delays, redundancy, and inefficiencies. Additionally, process maps can provide inputs to other advanced continuous improvement tools such as C&E analysis, RCA, MSA, SPC, FMEA, and capability studies. They also serve as means for documenting and communicating business processes; hence, they are often found in training, maintenance, technical and quality manuals.
Other Formats
Do you want to use the slides in your training courses?
Process Mapping Training Material: $25.85
Related Articles


Related Templates


