- Time to Read:
Also known as Operation Yield Measures.
Related topics include Sigma-Level Measures, Defect-Based Indicators, Lean Measures, Process Effectiveness Measures.
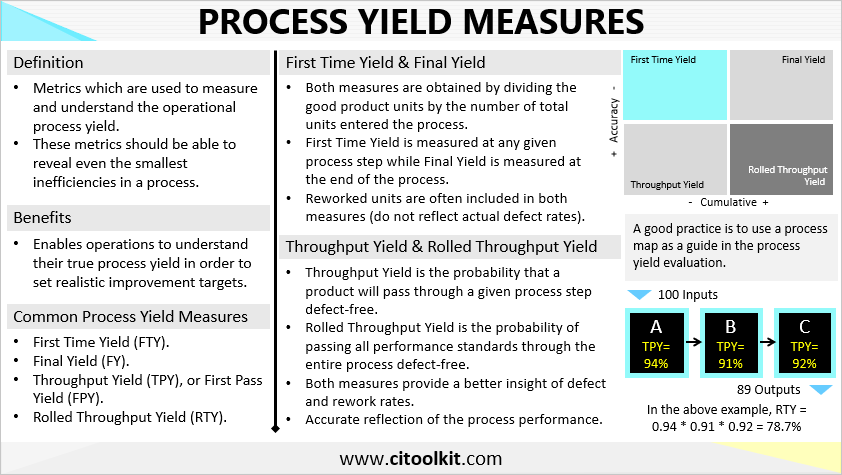
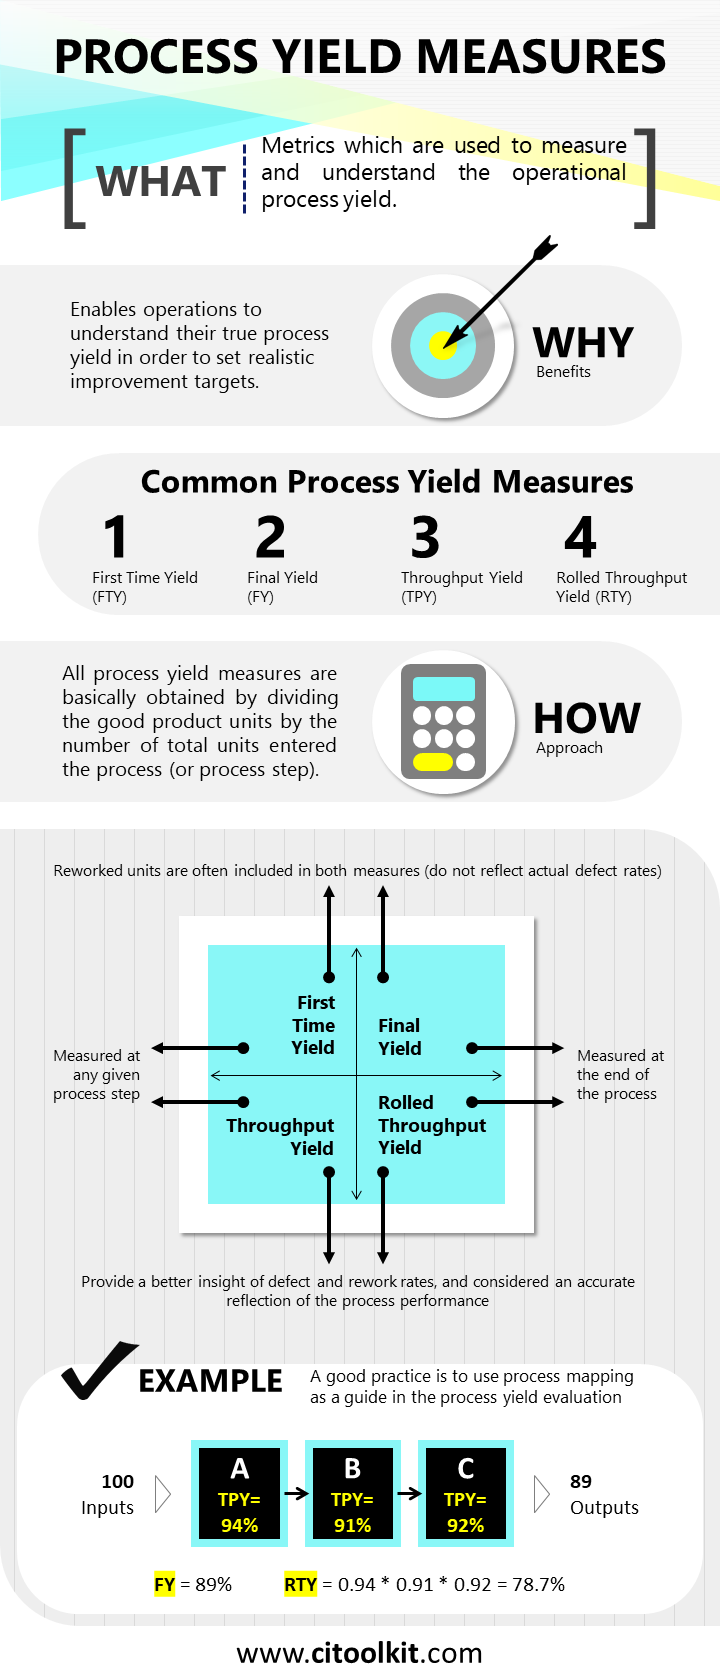
An ideal process must operate with zero defects and without rework. To unveil these unnecessary and costly inefficiencies, it is important to employ appropriate performance metrics for measure process yield, or otherwise, the true process yield might be underestimated. Process yield measures should be able to expose even the smallest inefficiencies within a process, empowering operations to understand their true process yield in order to set realistic targets for improvement.
Many organizations employ two primary measures of process yield: First Time Yield (FTY) and Final Yield (FY). These organizations often find they have high yield rates and assume their processes are performing efficiently and effectively. Both metrics represent the classic approach for calculating process yield and don’t account for the hidden factors such as rework and delays.
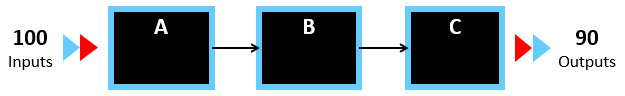
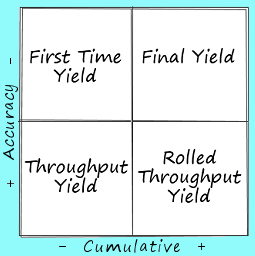
First Time Yield (FTY) is simply obtained by dividing the number of defect-free product units by the number of total units entered the process at a given process step, including reworked units. For example, FTY at a given process step which has produced 90 good units from 100 processed units would be 90 percent. FTY is not sensitive to product complexity and only looks at the volume of the produced units. Corrective actions are often taken on spot when mistakes are discovered, and rework may not be adequately recorded in quality logs, making the process yield rate looks better than reality.
Another widely adopted metric, Final Yield (FY), is easily calculated using readily available data. It is obtained by counting the defect-free units that successfully complete the entire process divided by the total units entered the process. In other words, if the number of units at the end of the process equals to what they were at the beginning, then the final yield would be 100 percent.
On the other hand, Throughput Yield (TPY) serves as a robust metric for assessing process yield. TPY measures the probability of a product unit successfully passing through a given process step without any defects on the first attempt. In other words, a reworked unit that passed the process step will not be considered in the calculation of throughput yield.
Rolled Throughput Yield (RTY) is yet another robust metric that comprehensively evaluates the entire process from start to finish. It quantifies the cumulative effects of inefficiencies found throughout the process and provides better insight of error and rework rates. RTY is determined by multiplying the individual throughput yield values of all process steps:
Rolled Throughput Yield (RTY) = Throughput Yield of process step 1 * Throughput Yield of process step 2 * ... * Throughput Yield of process N.
RTY enables companies to precisely assess the performance of their industrial or commercial processes, as it involves calculations at each process step. It’s worth noting that RTY is typically considerably lower than Final Yield, and organizations that initially calculate a Final Yield of 90 percent may discover their RTY to be less than 50 percent.
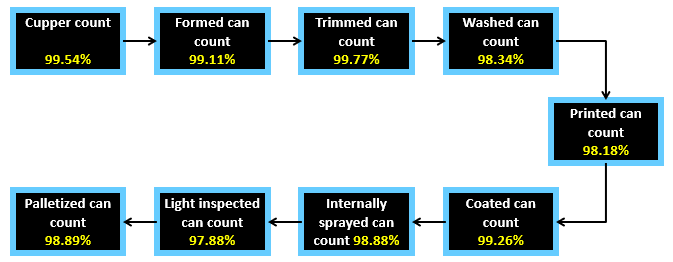
Example – High Volume Process
The following diagram illustrates a process map for can manufacturing. The probability of producing a can that meets all performance standards is 90.28% (i.e., RTY = 90.28%).
Example – Low Complexity Process
Question: Consider a process with three steps, each performing at a success rate of 0.94, 0.91 and 0.92 respectively. Suppose that 100 units entered the process and only 89 were good units. Find the final yield and the rolled throughput yield for the overall process.
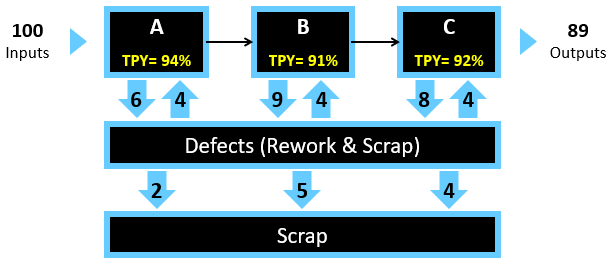
Answer: Final yield would be 89%, and rolled throughput yield would be: 0.94 x 0.91 x 0.92 = 78.7%. This means that even if the three processes are performing fairly well, one out of every 5 units will not make it through the process without being scrapped or reworked.
Many tools are available for computing process yield metrics. One of the simplest methods involves using this calculator.
Wrapping Up
Achieving an ideal process is essential for efficiency. Traditional process yield metrics like First Time Yield (FTY) and Final Yield (FY) are commonly used but might miss hidden issues, leading to overestimations of process capability. Throughput Yield (TPY) and Rolled Throughput Yield (RTY) offer better assessments taking into account defects and other inefficiencies. RTY can reveal lower yields than expected, prompting organizations to set realistic improvement goals for their processes. In summary, these metrics help organizations optimize their operations for better results.
Other Formats
Do you want to use the slides in your training courses?
Process Yield Measures Training Material: $15.85
Related Articles
Related Templates