- Time to Read:
Also known as Flow Process Chart and Process Flow Chart.
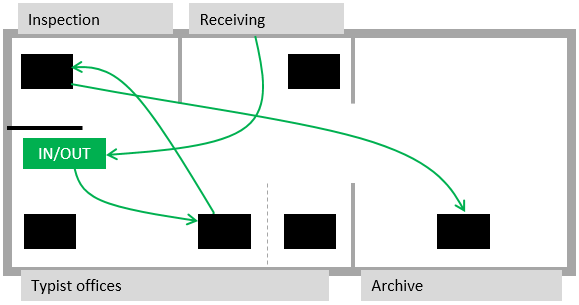
Related topics include Process Chart, Flow Diagram and Spaghetti Diagram.
Process Sequence Chart
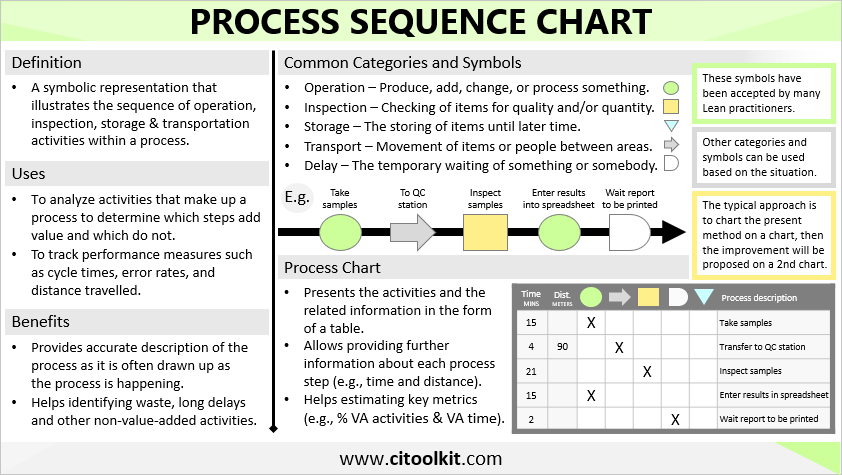
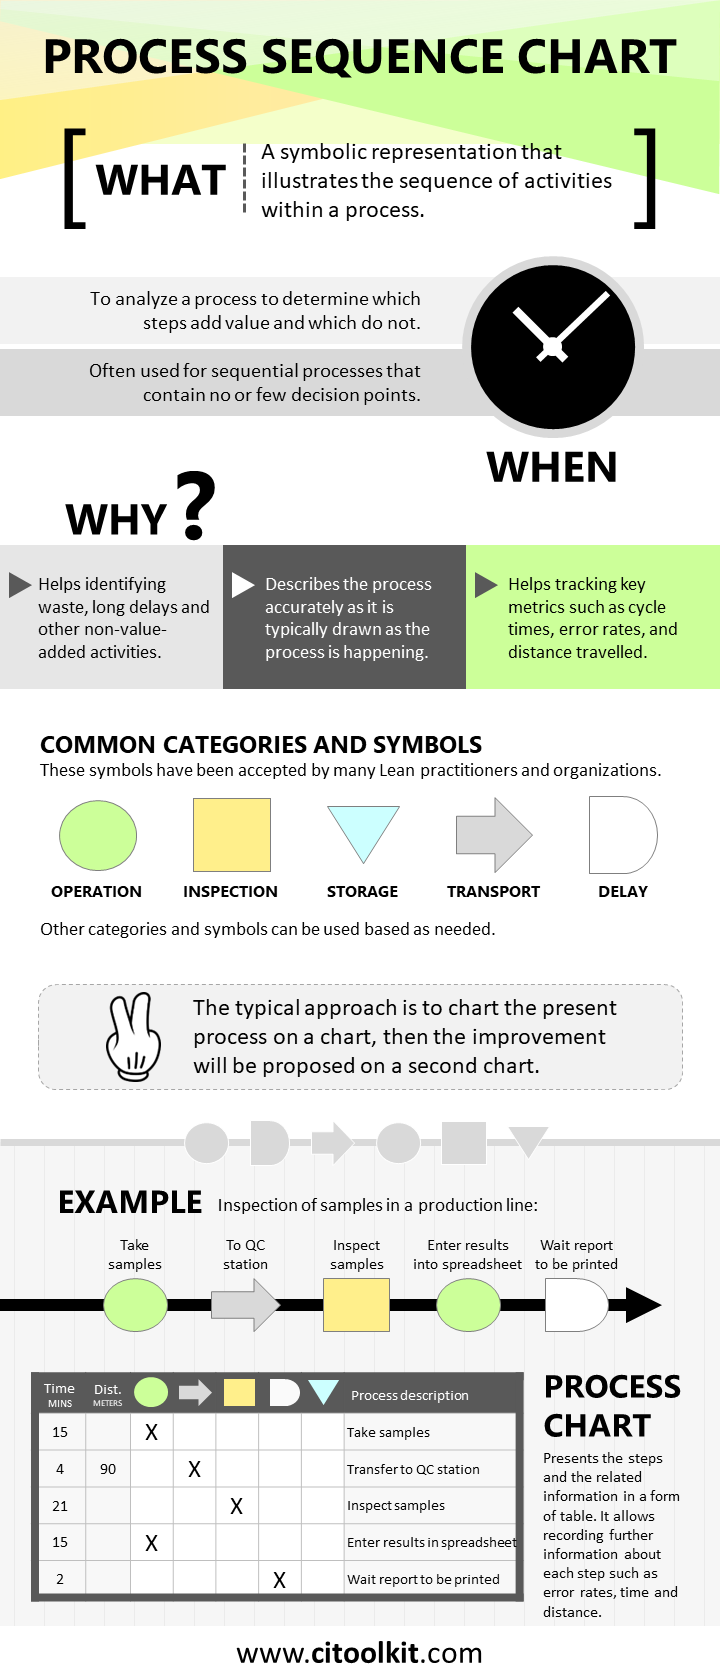
A process sequence chart is a symbolic representation that illustrates the sequential flow of activities within a process. It’s a useful technique for recording process activities and determining which steps add value and which do not. Process sequence charts are preferred over other process mapping techniques when the process is sequential in nature and contains no or few decision points. Activities in these types of charts can be any operation, inspection, storage or transportation actions that are carried out by individuals, teams, machinery, systems, or a combination of all.
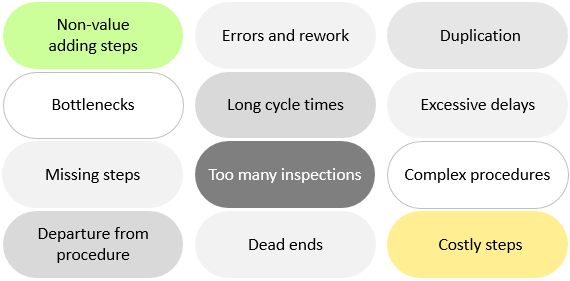
A useful feature of process sequence charts is that they can be drawn up as the process is happening, thus providing an accurate description of the process. Through observing and recording, one can for example follow a part, noting how and when it is operated, moved, inspected and stored. Later on and when analyzing the process, some steps become obvious candidates for improvement, such as non-value-added activities, long delays and excessive transportation.
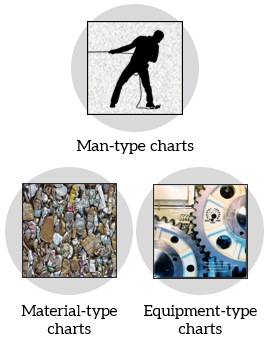
Process sequence charts can be categorized into three distinct types based on what is being charted:
- A man-type chart shows the activities of a person or group of people.
- A material-type chart shows what happens to a product or item as it moves.
- An equipment-type chart shows the activities from the perspective of the machine or equipment in use.
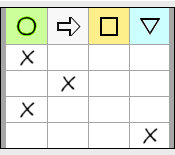
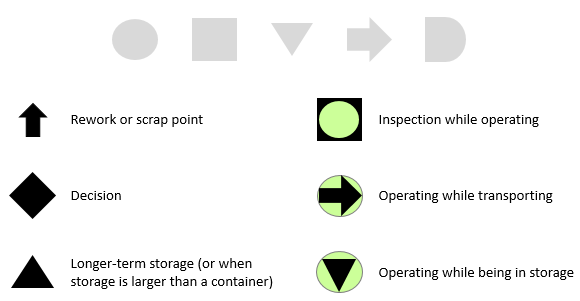
Within a process sequence chart, activities are documented along a vertical or horizontal line, using universally recognized symbols and descriptive notations. These symbols have been accepted by many Lean practitioners and organizations. Other symbols can be used when necessary.
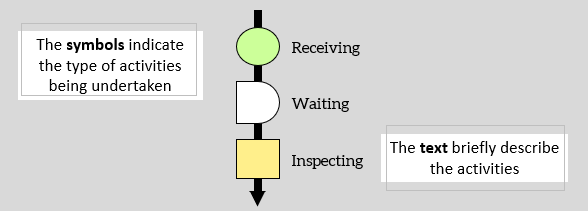
The following is a brief explanation of the common five categories used in a process sequence chart along with illustrative examples.
OPERATION – Produce, add, change, or process something.
Examples: Drilling a hole in metal and serving a customer at a call center.

INSPECTION – Checking of items to ensure correct quality and/or quantity.
Examples: Checking for defects, measuring the dimensions of a product, counting received products, and getting feedback from a customer.

STORAGE – The storing of something until later time.
Examples: Storing of finished goods in a warehouse and storing of supplies received in a storeroom as inventory.

TRANSPORT – The movement of people, materials, or other items between locations.
Examples: A forklift moving pallets from a warehouse into a loading bay and a customer walking from sales floor to cashier.
DELAY – The temporary waiting of something or somebody.
Examples: The time spent waiting for maintenance and repair activities and the time the customer spent waiting in a queue.

Care should be taken when choosing the right category, as a delay of a machine, for instance, may be misidentified as an inspection carried out by an operator or a transportation activity.
A good practice is to chart the present process as well as the envisioned future process in order to drive continuous improvement. A typical approach involves charting the present process first and then proposing improvements in a separate chart.
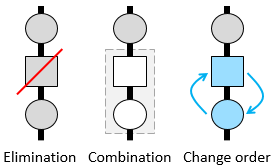
Improvements to the process can be achieved by reducing the number of activities, reducing the duration of each activity, or reducing the distance of travel for the transport activities. For this reason, it is important to track performance measures such as cycle times, error rates, and travel distances.
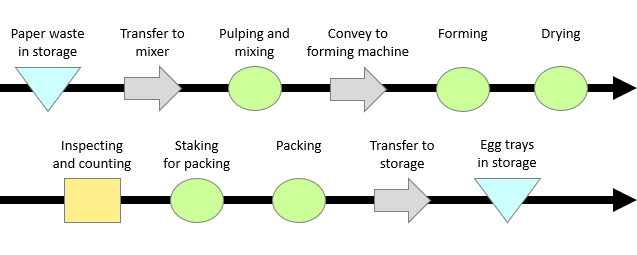
Example
The following example illustrates a material-type process sequence chart prepared for an egg tray production line. Note that the time it takes to perform each activity can be written under the corresponding symbols.
Process Chart
A process chart presents the process activities and related information in the form of a table. This technique allows the detailed recording of supplementary data to each activity, including error rates, time and distance. Such information can help later in estimating key performance metrics, including:

- The percentage of the value-added activities to the total activities.
- The total time to perform the process.
- The distance travelled.
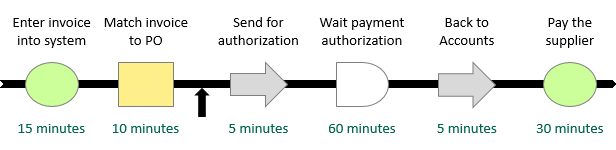
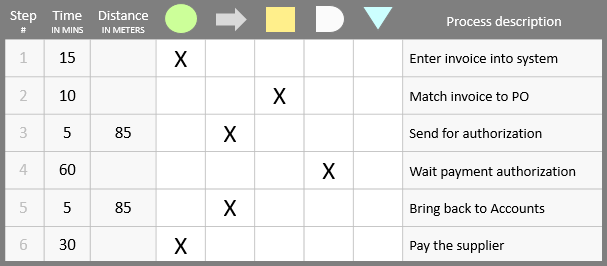
Example
The following example shows a process sequence chart and a process chart for processing an invoice upon receipt by the supplier. The process begins after receiving the invoice and ends with paying the supplier.
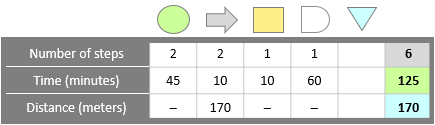
The following table serves as a summary of the above process chart which is useful for estimating key performance indicators.
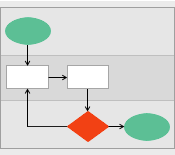
Process sequence charts and process charts are sometimes created in conjunction with other tools such as flow diagrams and opportunity flowcharts, to yield a more comprehensive understanding of the process.
There are many tools that can help in charting your processes. One of the simplest and most straightforward ways is to use this process chart MS Excel template.
Wrapping Up
Process sequence charts and process charts show the order of activities within a process. They are best used for processes with a straightforward and low-decision structure. These charts can be created in real-time, thus providing an accurate description of the process. Activities are represented with common symbols, with the option to use other symbols when necessary. To promote continuous improvement, it’s good practice to chart both the current process and the desired future process.
Other Formats
Do you want to use the slides in your training courses?
Process Chart Training Material: $20.85
Related Articles
Related Templates


