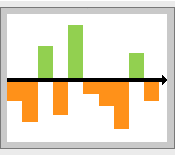
A time value map is a tool to visualize the allocation of value-added and non-value-added time within a process. In this graphical representation, all activities are plotted as bars proportional to their time values along a horizontal timeline. Only value-added activities are plotted above the timeline while all other activities are plotted below. This template is useful for examining where time is wasted in any given process.
This template runs in Microsoft Excel, and you can use and modify it to meet your specific needs. For example, you may want to add additional rows if your process includes more than eighteen steps. Furthermore, you may specify the type of activities whether they are operations, transportation, inspections, delays, or storage.
In addition to displaying the timeline, this template also generates a stacked bar chart that facilitates a comparative analysis of value-added versus non-value-added time.
Time Value Template (32 KB)
Time Value Template Example (32 KB)
Related Templates


