Continuous Improvement Toolkit
Effective
Tools
for Business and Life!
Search
Libraries
Articles
Templates
Slides
Posters
Infographics
Examples
Exercises
Maps
CI Map
Lean Tools Guide
Yellow Belt Guide
Green Belt Guide
Black Belt Guide
PMBOK Tools
Change Tools
DMAIC Process Guide
Basic Quality Tools
Blog
Shop
Category:
Performance Management
The Impact of Benchmarking on Performance and Continuous Improvement
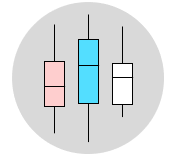
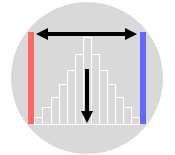
The Role of Box Plots in Comparing Multiple Data Sets
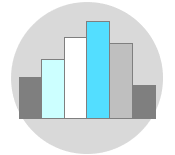
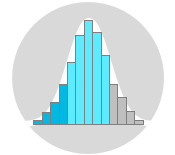
The Role of Histograms in Exploring Data Insights
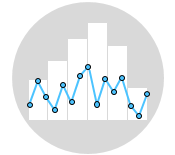
Graphical Analysis
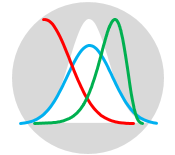
Normal Distribution
Probability Distributions
Descriptive Statistics
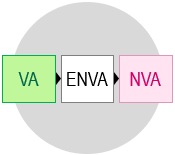
Lean Concept of Value
Lean Concept of Waste
Value Stream Mapping: A Visual Approach to Process Optimization
Exploring Histograms and Box Plots: Similarities and Differences
Measuring True Process Yield Using Robust Yield Metrics
Next Page
→