Continuous Improvement Toolkit
Effective
Tools
for Business and Life!
Search
LIBRARIES
Articles
Templates
Slides
Posters
Infographics
Examples
Illustrations
Exercises
How-To Guides
MAPS
CI Map
Lean Tools Guide
Yellow Belt Guide
Green Belt Guide
Black Belt Guide
PMBOK Tools
Change Tools
DMAIC Process Guide
Basic Quality Tools
BLOG
SHOP
Author:
CIToolkit Content Team
Normality Testing in Minitab
Probability Distributions in Minitab
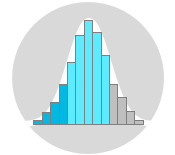
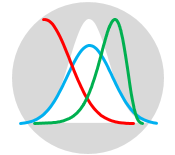
Normal Distribution
Probability Distributions
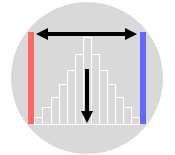
Descriptive Statistics in Minitab
Descriptive Statistics
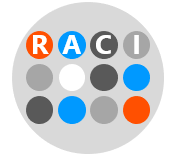
How RACI Matrix Streamlines Stakeholder Engagement
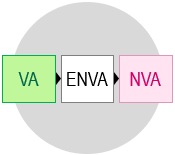
The Concept of Lean Value Analysis
The Concept of Lean Waste Analysis
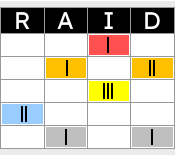
RAID Log Template
Risk Analysis
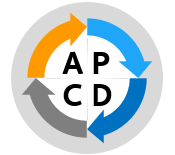
Applying the PDCA Cycle: A Blueprint for Continuous Improvement
←
Previous Page
Next Page
→
My Cart
0
Qty:
Discount
Add Coupon Code
Apply
Subtotal
Total Installments
(before discounts)
Bundle Discount
Checkout
0
Notifications