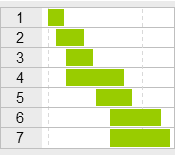
A Gantt chart is a way to graphically represent progress of any given project. It effectively outlines all involved activities and illustrates other project details such as activity start and end dates, completion percentages, responsible individuals, and more. Gantt charts are useful in keeping both the project team and key stakeholders informed about the progress of the project.
This template is available in different variations and in various file formats including MS Excel. One version automatically generates the Gantt chart based on entered start dates and activity durations, while the other versions require manual construction. Regardless of the version chosen, all templates require entering a list of activities along with the corresponding start date and end dates.
These templates can be modified for your own use and depending on your specific requirements. For example, you may want to add more rows to include more activities or insert more columns if an extension of the timeline is required. Note the differentiation between main and sub-activities can be achieved through the ID column or by manually applying different colors and formatting to the activity list.
Simple Action Plan Template (68 KB)
Manual Gantt Chart Template (20 KB)
Auto Gantt Chart Template (24 KB)
Manual Gantt Chart (100 Actions Items – 40 KB)
Project Timeline Template (80 KB)
Related Templates


