Second-Level Cause |
Third-Level Cause
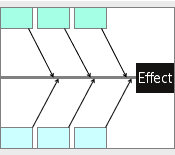
The fishbone diagram is an effective tool for visually presenting the relationships between causes and effects in a clear and understandable manner. It is also referred to as cause-and-effect diagram and Ishikawa diagram. This fishbone diagram template is designed to help the identification of potential causes related to a specific effect or problem. You can then plan and implement actions to address the key causes.
This template comes in three different variations, each accommodating different levels of potential causes. The first variant allows to add only the first level of potential causes, another for two levels, and a third for three levels. Remember however that the template does only allow to enter causes in a linear sequence. Users should be aware that entering multiple sub-causes under one parent cause requires manual intervention.
This template comes in both Microsoft Excel spreadsheet and Microsoft PowerPoint presentation that you can use and modify to meet your specific needs. For example, you may increase the number of potential causes per category and change their positions. It comes with ready to fill textboxes which simplify the process of adding the potential causes. Just fill the textboxes with the potential causes under the relevant categories.
Although this template uses the 6 Ms approach for labeling the categories, you may use any other approach and create your own branches that best suit your project’s needs. You can also download our 6 Ms checklist to help you better log all possible causes under the appropriate categories.
In essence, this template empowers users to conduct thorough cause-and-effect analyses, providing a structured framework for identifying and addressing the root causes of problems.
Fishbone Diagram Template (96 KB)
Fishbone Diagram Template Examples (100 KB)
Fishbone Diagram Template (48 KB)
Fishbone Diagram Checklist (24 KB)
Related Templates


