This example illustrates a typical PEST analysis, where factors are organized as opportunities and threats under the four key categories: Political, Economic, Social, and Technological.
This example presents a typical PESTLE analysis in which entries are categorized as opportunities and threats under each of the six PESTLE dimensions—Political, Economic, Social, Technological, Legal, and Environmental.
This roadmap offers a structured approach for scanning the external business environment using the PESTLE model. It follows an eight-step process and is designed to be straightforward and easy to complete.
This illustrative tree presents a hierarchical structure developed from a brainstorming session aimed at identifying the full range of PESTLE factors relevant to a specific company. It can be used as a guide for conducting any PESTLE analysis exercise.
This example illustrates a defect reduction project that uses a risk matrix heat map to visually represent risks. The PowerPoint heat map template makes it easier to identify and prioritize risks based on their impact and likelihood.
This example shows a defect reduction project that uses a risk matrix heat map to visually display risks. The Excel heat map template helps in identifying and prioritizing risks based on their likelihood and potential impact.
This example uses the Lean maturity assessment template to illustrate how the dashboard appears after completing the worksheets for the six Lean categories: Leadership, Support Systems, Value Stream, Continuous Improvement, Lean Techniques, and Standard Work.
This worksheet, focused on “Continuous Improvement,” is part of the Lean maturity assessment template. Together with the other category-specific worksheets, it helps assess the overall level of Lean implementation across any facility.
This Lean audit checklist is designed to assess the status of Lean implementation and maturity within any facility. It focuses on three advanced categories: Continuous Improvement, Lean Techniques, and Standard Work.
This Lean audit checklist is designed to assess the status of Lean implementation and maturity within any facility. It focuses on three basic categories: Leadership, Support Systems, and Value Stream.
This example illustrates how to use the Health and Safety Risk Assessment form (in Microsoft Word format), which is designed to capture the essential information needed to identify workplace-related risks in any site or facility.
This Health and Safety Risk Assessment Register is an Excel worksheet used to record the results of all risk assessments conducted within a site or facility. It supports ongoing risk management by enabling the tracking and comparison of risks over time.
This is an example of a process map about handling customer complaints created using a Microsoft PowerPoint template. It follows a simple-drawing format, using only boxes and arrows to represent the flow, which is ideal for illustrating basic processes clearly and efficiently.
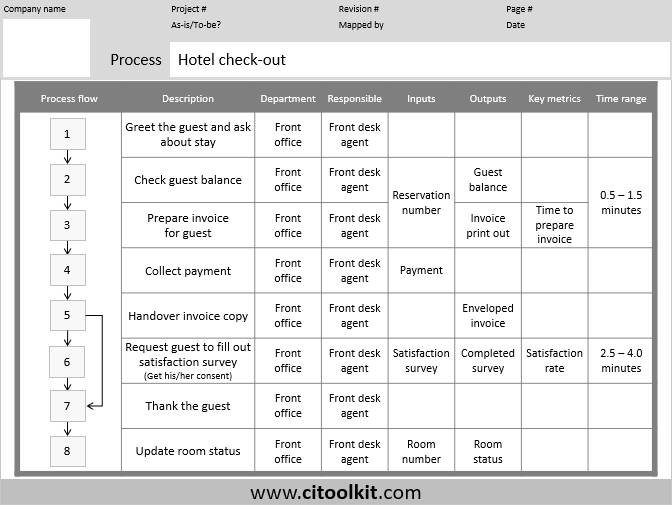
This is an example of a process map for a hotel check-out process. It uses a tabular format that allows more information to be displayed in the process map, including inputs, outputs, performance metrics, responsible persons, and the duration required for each activity.
This is an example of a process map for repairing defective units by an IT dealer. It uses a time-function format that displays time on one axis and functions (or departments) on the other, which make it easier to visualize the sequence of activities and their duration across different roles.