Also known as Flow Diagram, Activity Flowchart, Process Diagram.
Variants include Process Sequence Chart.
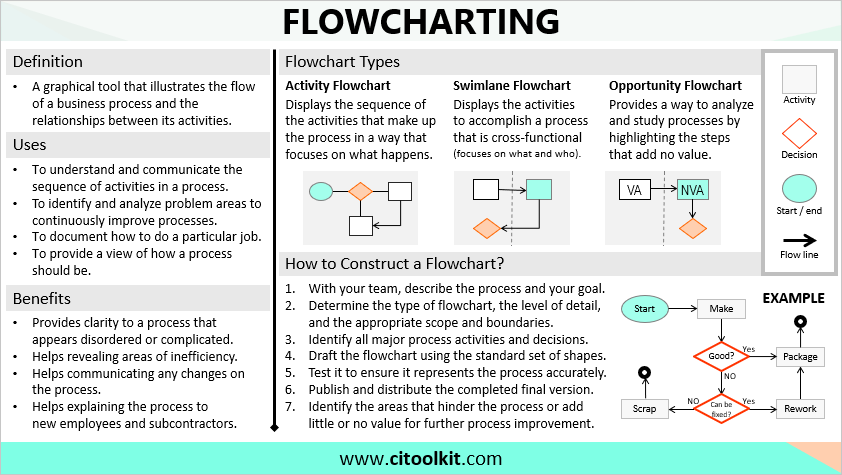
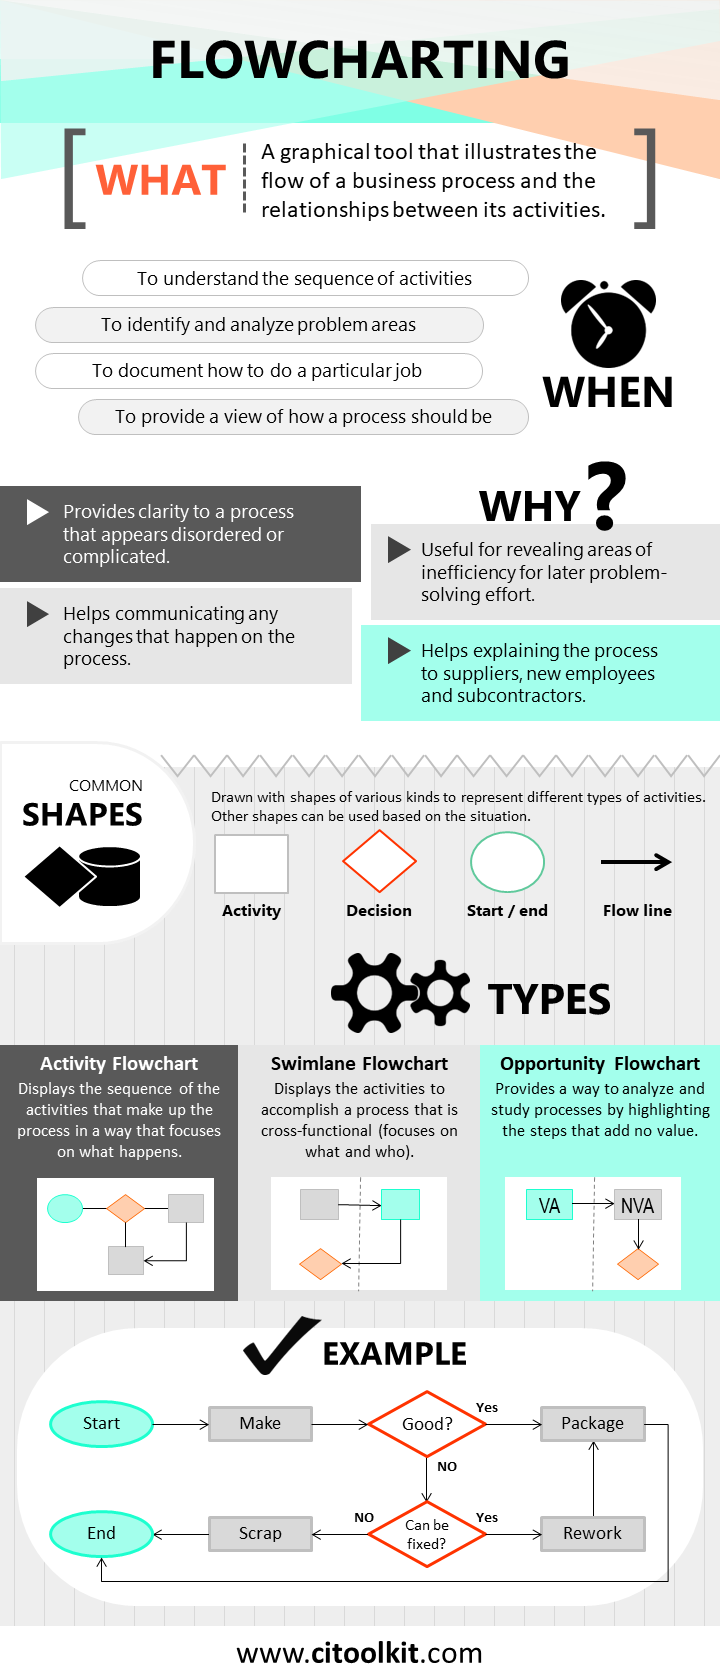
A flowchart is a visual representation tool that illustrates the flow of a business process and the interconnections between its activities. It allows to break up any process into individual activities and see how they fit together. The simplicity of flowcharts makes them useful for understanding any process and identifying areas of waste and inefficiency, thus facilitating targeted problem-solving efforts. They can be used across multiple industries and functions, making them universally applicable.
Flowcharts are ideal tools to visually representing business processes. For example, they are useful when trying to understand the step-by-step flow of activities in processes like purchase order or sales order in a company. They help in understanding what activities and decisions are involved, and thus, ensuring accurate execution in the right sequence. This is why they are often used to document how to do a particular job and can be found in procedures and quality manuals.
In addition to their role in documenting existing processes, flowcharts are also used when designing new processes aimed at facilitating organizational transformation. Software developers are using flowcharts to map out processes that need to be automated. Similarly, Kaizen teams are using them to identify and analyze problematic areas, subsequently streamlining the work and enhancing the performance.
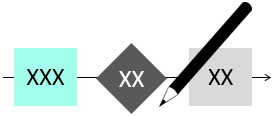
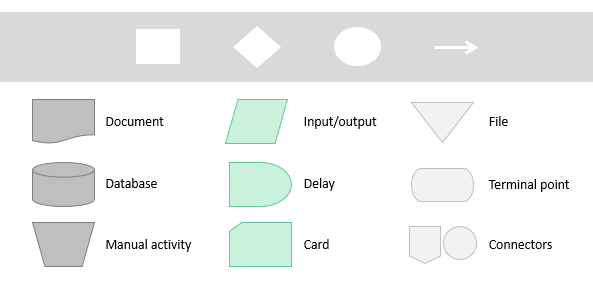
Flowcharts are typically drawn with arrows and shapes of various kinds to denote different types of activities. While there is no universally prescribed format for flowcharts, adhering to a standardized set of shapes ensures they are drawn in a consistent manner. It is advisable to check whether your organization has established a standard set of shapes or symbols that must be adhered to.
The following outline the basic shapes that are applicable in most situations:
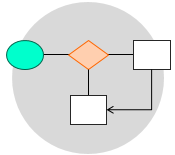
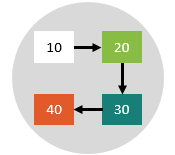
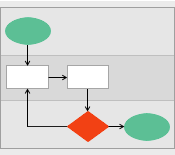
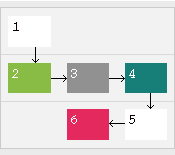
Activity – The most frequently used shape which represent the task or action to be performed (denoted as a plain rectangle).

Decision point – Requires a YES or NO response. Other options are also valid such as (TRUE or FALSE) and (LESS THAN, EQUAL or MORE THAN).

Start / End – Defines the process boundaries. Also used to indicate that a branch from a decision comes to an end.

Flow line – Connects the shapes and indicates the flow of the process as well as the loops.

A single flowchart can quickly become complex and lengthy. That’s why connectors are often used to link sub-processes and indicate converging paths. Moreover, additional shapes can be used to describe the type of activities more specifically. Additionally, flowcharts have the capability to incorporate supplementary information, such as assigning responsibility for each activity and specifying the time required for completing the activity.
Flowcharts are widely used in particular industries, such as software development, auditing and quality management. In each of these domains, industry-specific shapes and symbols are often used to ensure specific activity representation.
In the subsequent sections, we will discuss of the three common types of flowcharts.
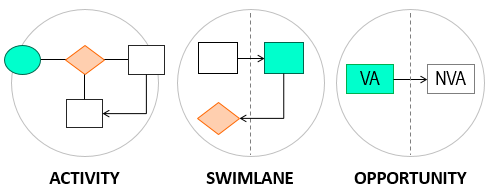
Activity Flowcharts
An activity flowchart serves to illustrate the sequential order and progression of activities within a process, focusing on what happens. It represents the basic form of flowcharts and typically illustrates the flow of activities, their order, decision points, loops of rework and process boundaries. While there is no precise format for an activity flowchart, it is important that it is represented in a consistent and uniform manner.
Example – Making a Cup of Tea
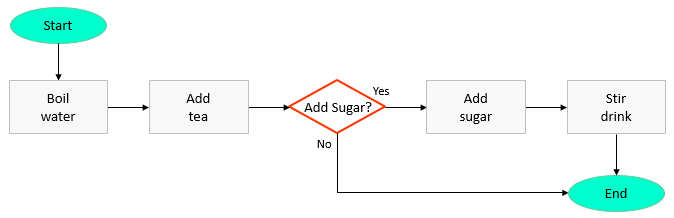
Note: Cycle time refers to the duration from the initiation to the completion of a process. In the context of this example, it is the time required to prepare a cup of tea.
Example – Preparing Reports for Decision Makers
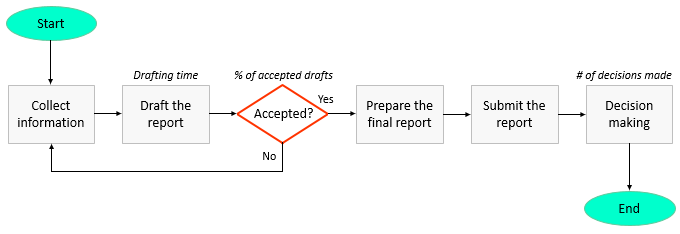
Note: Flowcharts have the capacity to incorporate additional information. In this particular example, performance indicators that need to be captured have been included above specific activities.
Example – Changeover
The following is an example of a flowchart that has been created for a changeover operation, specifically a size conversion, for a production line.
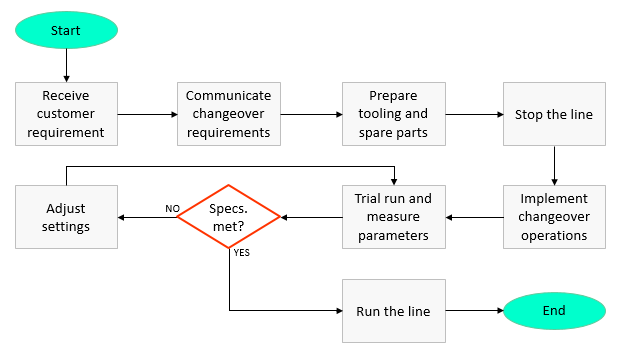
Note: There is a rework loop in this manufacturing process where the approver rejects to run the line until the specified requirements are met.
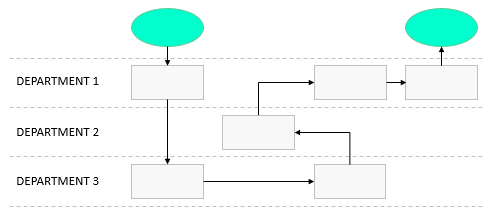
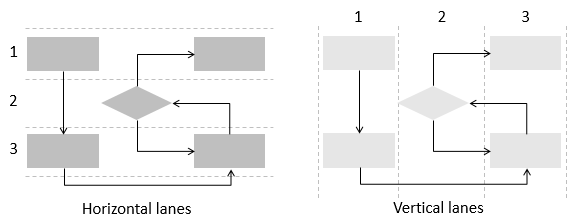
Swimlane Flowcharts
A process is described as a cross-functional when it involves multiple departments, and a swimlane flowchart illustrates the sequence of activities required to accomplish a cross-functional process. This type of flowchart is divided into multiple lanes, representing the multiple responsibilities within the process. Activities or decisions falling within a specific lane are under the control of the corresponding department, work group, or individual. This helps clarifying the responsible for executing activities and making decisions.
Swimlane flowcharts are particularly helpful for non-manufacturing processes that mainly involve the flow of information, knowledge, and documents across multiple functions. Such processes often involve many handoffs where information and documents are exchanged among departments, work groups or individuals. An excessive number of handoffs within a process can indicate potential waste due to unnecessary transporting, wasted motion or overprocessing.
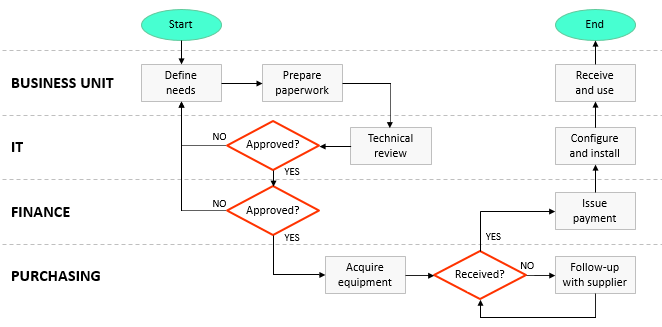
Example – Acquiring New Equipment
The following example illustrates a cross-functional flowchart showcasing the process of equipment acquisition in a company.
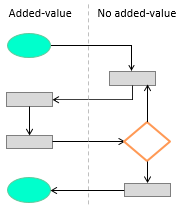
Opportunity Flowcharts
An opportunity flowchart provides a way to analyze and study business processes by highlighting those steps that contribute to waste and complexity. This type of flowchart is typically divided into two sections to differentiate the activities and decisions that add value from those that do not.
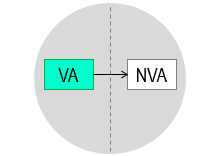
These types of flowcharts will increase the awareness regarding what previously was accepted as normal and unavoidable waste. By isolating the non-value-added steps, the opportunity flowchart facilitates a clearer identification of areas for improvement. The elimination or reduction of non-value activities presents a significant opportunity to simplify and streamline the process, and this is one of the core objectives of the lean methodology.
Example – Use of an Office Copy Machine
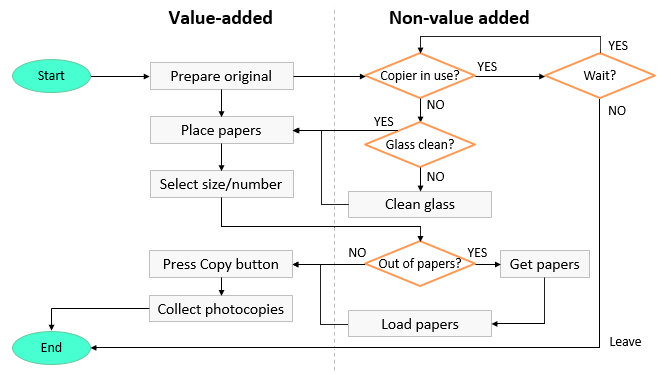
With the development of this flowchart, it becomes clearer where continuous improvement efforts should be focused to maximize value delivery. For example, implementing regular cleaning of the copier glass and monitoring paper availability are potential improvement ideas for this process.
Constructing a Flowchart
Whether you want to draw an activity flowchart, a swimlane flowchart, or an opportunity flowchart, the following straightforward steps can help you construct your flowchart:
- With your team, describe the process and your objectives.
- Determine the type of flowchart, the level of detail, and the appropriate scope and boundaries.
- Brainstorm and identify all major process activities, decisions and the sequence of completion.
- Draft the flowchart using the standard set of shapes, Label each step appropriately.
- Prepare the final flowchart, check for missing activities or decisions, and add further details as necessary.
- Test the flowchart to make sure that it represents the process accurately and completely.
- Publish and distribute the completed final version of the flowchart to all concerned.
- Update the procedures and other documentation as necessary.
- Identify the areas that hinder the process or add little or no value for further process improvement.
- Plan and implement actions to reduce inefficiencies and waste.
Flowcharts and Document Management
Every company should establish a standardized way for documenting their procedures and processes. Flowcharts prove to be useful in summarizing a procedure, process or work instruction. They can play an important role in document management and may either be included under the relevant procedure or be placed in the appendix at the end of the document or manual.
Flowcharts and Software Applications
The process of drawing a detailed flowchart can be an overwhelming task. This is where applications and online services can offer the flexibility that a piece of paper cannot. While it is possible to create flowcharts by hand, it is often more convenient to use any of the drawing applications to create visually appealing flowcharts. A recommended practice is to initially draft the flowchart on paper before refining it using an application.
There are many software applications and online services that allow the creation of professional flowcharts including Microsoft Visio, SmartDraw and Micrografx. However, one of the simplest ways is to use this flowchart template.
Wrapping Up
Flowcharts facilitate documentation of current job procedures, and are useful when designing new processes aimed at facilitating organizational transformation. They are commonly utilized by system analysts, software developers, and Kaizen teams, and are often found in procedures and quality manuals. By addressing areas of inefficiency, such as unnecessary activities, bottlenecks, complex procedures and missing steps, flowcharts empower organizations to optimize their operations.
Other Formats
Do you want to use the slides in your training courses?
Flowcharting Training Material – $22.85
Related Articles
Related Templates
