Blog
-
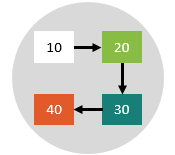
Flowcharting: The Three Common Types of Flowcharts
Also known as Activity Flowchart and Process Diagram. Related topics include Process Sequence Chart and Flow Diagram. A flowchart is a visual representation tool that illustrates the flow of a business process and the interconnections between its activities. It allows to break up any…
-
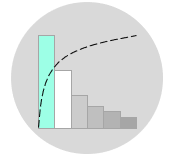
Pareto Analysis: Identifying the Vital Few from the Trivial Many
Also known as The Law of the Vital Few and The 80/20 principle. The Pareto principle, also known as the 80/20 rule, is a guiding principle that helps to focus on the most important matters. It describes a phenomenon that a small number of…
-
Improving Operations Through Observation and Gemba Walks
Also known as the Go See Technique and Going to the Gemba. Related topics include Management by Walking Around (MBWA). Many managers nowadays try to resolve work-related issues while they are sitting in their offices or conference rooms. Attempting to resolve problems in such…

-
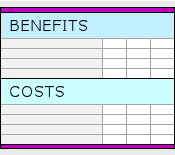
Cost Benefit Analysis Template
Cost-benefit analysis is the process of calculating and comparing the costs and benefits before selecting an option or project. This template allows decision makers to select the solution or project that offers the greatest return against the cost of implementation. For simplicity, the analysis…
-
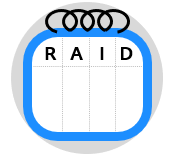
Using the RAID Log to Monitor Your Project
Also known as RAID Register and Project Monitoring Log. Related topics include Risk Register, Change Log, Lessons Learned Log and Decision Register. Throughout the course of any project’s lifecycle, many things may arise along the way that can affect the project’s ultimate outcome and…
-
Measuring True Process Yield Using Robust Yield Metrics
Also known as Operation Yield Measures. Related topics include Sigma-Level Measures, Defect-Based Indicators, Lean Measures, Process Effectiveness Measures. An ideal process must operate with zero defects and without rework. To unveil these unnecessary and costly inefficiencies, it is important to employ appropriate performance metrics…

-
Benchmark Summary Report Template
Benchmarking is a process that allows to measure how a company is performing against top-performing organizations worldwide. By doing so, companies gain insights into the practices and strategies that set these outstanding companies apart. This understanding will help in developing plans to apply the…
-
Mind Mapping: A Visual Approach to Organize Ideas and Thoughts
Also known as Idea Mapping, Spider Diagram and Spray Diagram. Related topics include Concept Mapping and Unified Modeling Language. Consider the last time when you took notes during a meeting or interview. You may have felt overwhelmed due to the multitude of ideas and…

-
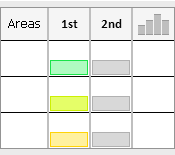
Project Selection Template
This project selection template is designed to support the project selection process. It allows the identification of the most appropriate improvement projects and subsequently prioritize them according to their potential impact on the business. By doing so, this tool ensures business priorities are taken…
-
Paired Comparison Analysis: A Practical Tool for Evaluating Options and Prioritizing Solutions
Also known as Paired Comparison Method, Pairwise Comparison and Pairwise Evaluation. Related topics include Prioritization Matrix, Pugh Matrix and Weighted Decision Matrix. Paired Comparison Analysis is a systematic approach for evaluating a small range of options by comparing them against each other. This technique…

-
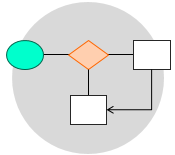
Process Mapping: The Simple Drawing Way to Map Business Processes
Also known as Business Process Mapping and Process Modeling. Related topics include Flowcharting and Value Stream Mapping. A process map is a graphical representation that illustrates the sequence of activities within a business process. It represents these activities in a step-by-step manner to help…
-
Improvement Roadmap Template
An improvement roadmap is a strategic approach for guiding the implementation of long-term improvement journeys. Whether you are a department manager, a Lean practitioner or Master Black Belt, this improvement roadmap template enables you to outline your improvement goals, identify the baseline performance of…