- Time to Read:
Also known as Why-Why Analysis.
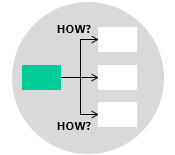
Related topics include How-How Diagram.
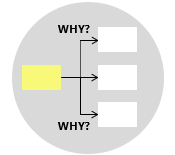
The five whys technique is most effective for solving simple and straightforward problems with a single root cause. Oftentimes, problems arise from multiple causes occurring together, each cause is the result of a further cause or multiple causes. Each time you ask “Why”, there might be more than one answer. Such hierarchical structure of potential causes can be represented in a fishbone diagram or a tree diagram known as the Why-Why Diagram.
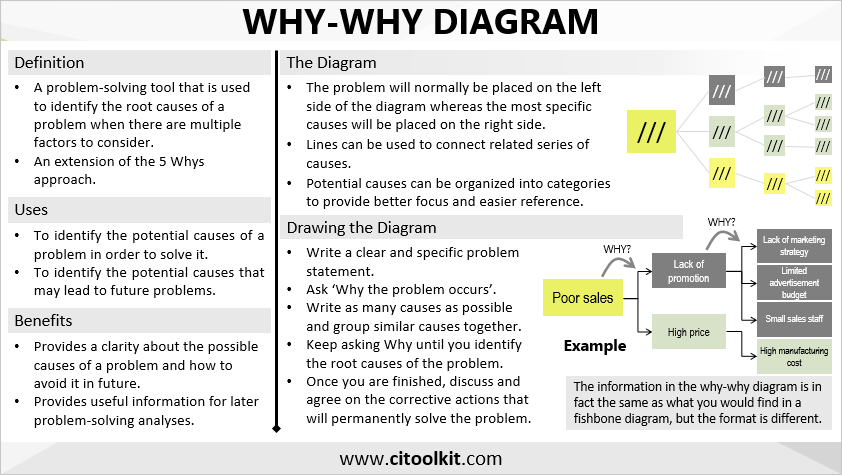
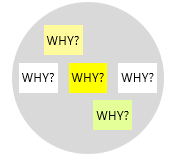
A why-why analysis is an extension of the five whys technique where they are similar in that they both ask the same “Why” question multiple times. However, the why-why diagram is used to identify the root causes of a problem when there are multiple factors to consider. In this situation, there may be multiple answers at each stage, and each of these answers need to go through a separate analysis process of asking the question “Why”.
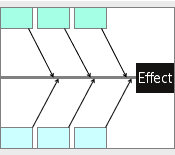
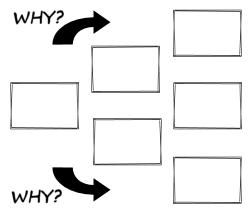
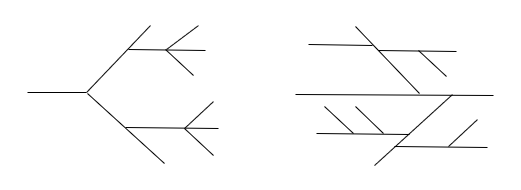
In the why-why diagram, the problem is typically positioned on the left side of the diagram whereas the most specific causes are positioned on the right side. Lines can be established to link related series of causes. The resulted diagram is in fact the same as what you would find in a fishbone diagram, but the format is different. And similar to the fishbone diagram, potential causes can be organized into categories to provide better focus and easier reference.
Drawing the Diagram
Why-why diagrams are commonly developed during collaborative brainstorming sessions. By going through the steps of drawing the diagram with your team, everyone gains a better understanding of the problem, making the solution easier to find later.
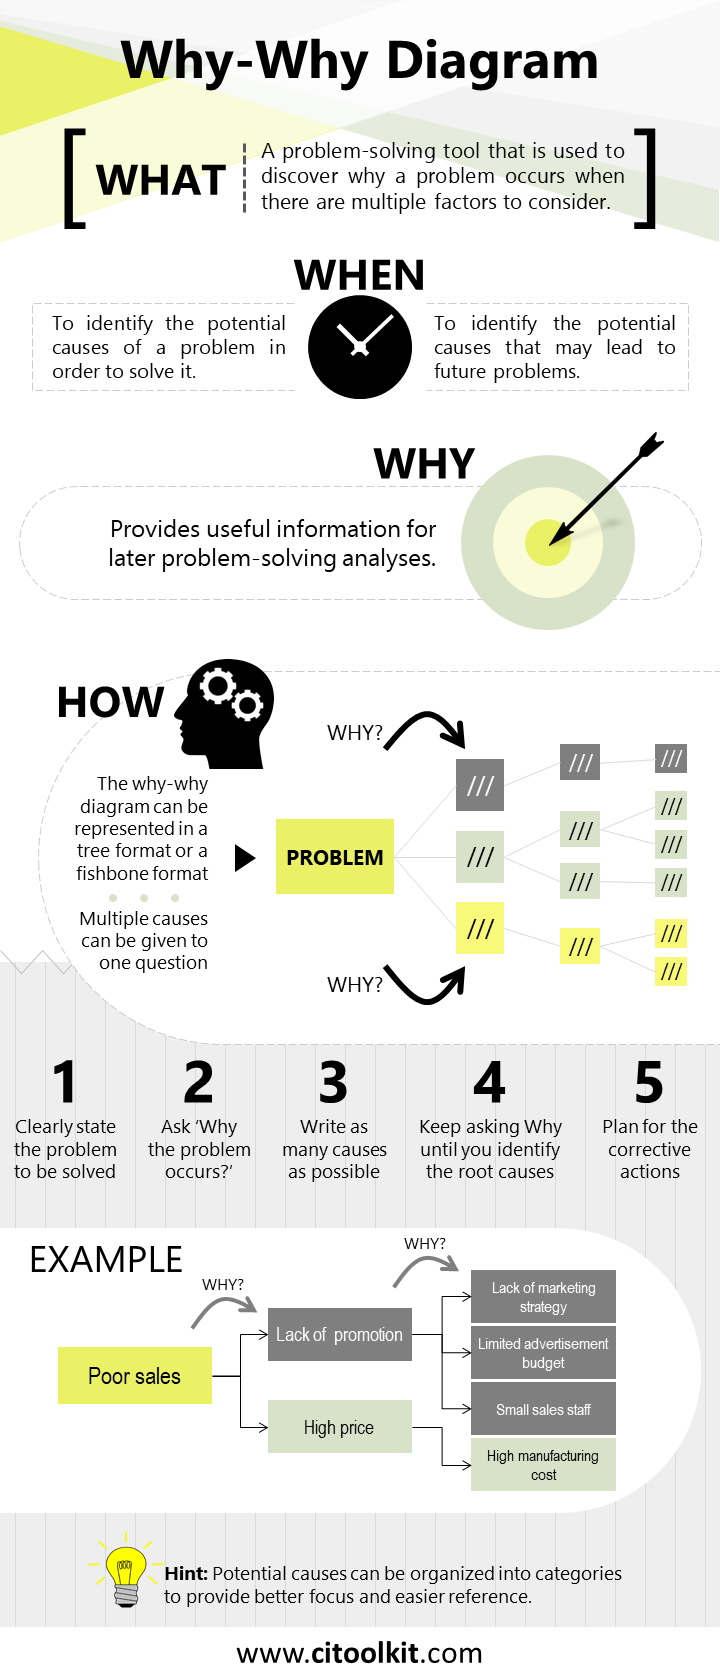
- With your team, clearly state the problem then write it on a post-it card.
- Place the problem card on the left side of a whiteboard or wall.
- Ask “Why the problem occurs”. Let the team members write as many causes as possible on post-it cards, group similar causes together, then stick them up to the right of your problem.
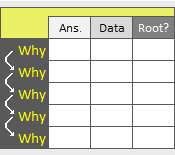
- Keep asking “Why” until the team identifies the root causes of the problem.
- Once you are finished, discuss and agree on the corrective actions that will permanently solve the problem.
Note: It may be necessary to collect and analyze data to confirm the identified root causes are real.
Example
A restaurant team has constructed a why-why diagram as part of their efforts to resolve a complaint regarding the increased number of customer complaints about the taste of their coffee.
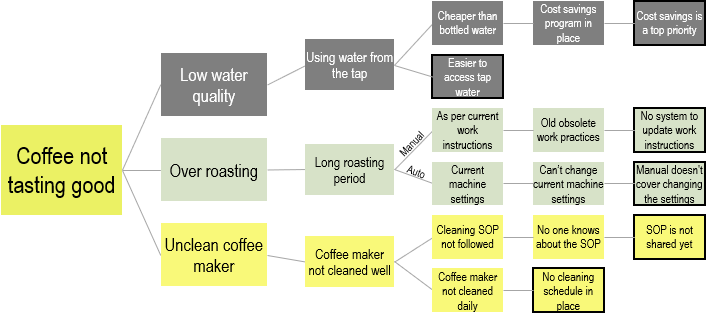
Note that the team has identified six possible root causes, marked with a black border, that require further investigation.
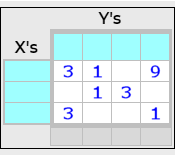
A cause-and-effect matrix can be used to effectively prioritize the causes of the problem. This will minimize the need for more statistical analysis of inputs that are unlikely to have an impact on the output.
Wrapping Up
Why-Why diagram is an extension of the five whys technique used to identify the root causes of a problem when there are multiple factors to consider. The resulting diagram, with the problem on the one side and specific causes on the other side, looks like a fishbone diagram but in a tree diagram format. Just like the fishbone diagram, the why-why diagram can also categorize potential causes for better organization and reference.
Other Formats
Do you want to use the slides in your training courses?
Why-Why Diagram Training Material: $15.85
Related Articles
Related Templates