- Time to Read:
Also known as Relationship Diagram and Relations Diagram and Network Diagram.
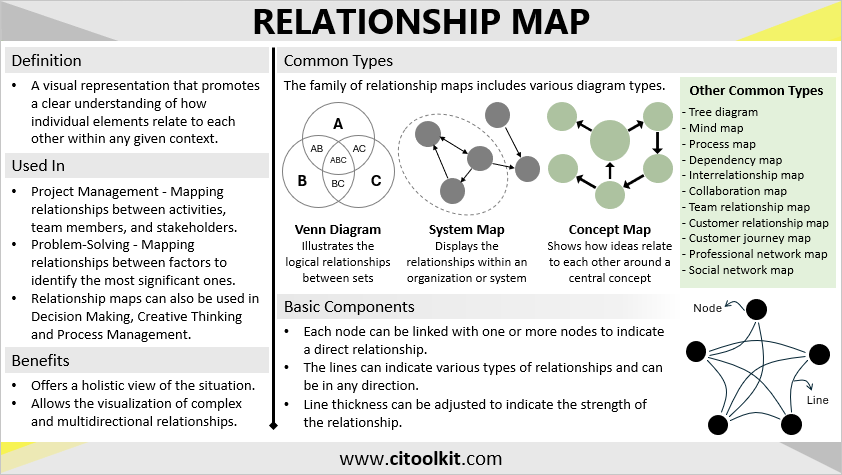
In a world full of connections and interactions, understanding the relationships between things is important. A Relationship Map is a helpful tool that visually displays connections within any given context. It makes it easy to understand how individual elements relate to each other. Relationship maps can be adapted to meet the needs of various fields and contexts including personal, professional, social, organizational and systemic aspects.
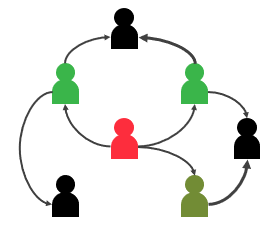
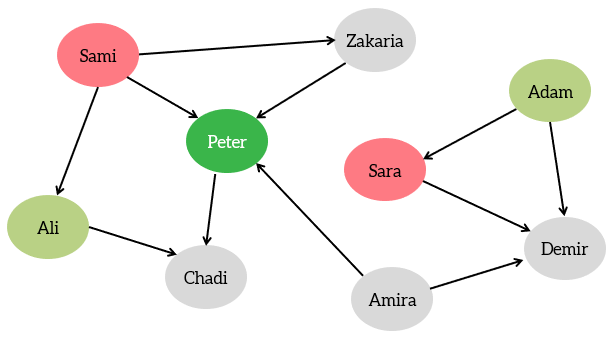
A straightforward example of a relationship map involves mapping your network of professional connections (as illustrated in the right figure). Creating a visual relationship map of your professional connections can be useful as it helps in a better understanding of your professional network. This visual map can later be used to identify potential collaboration opportunities within your professional community and enables you to build a strong support system.
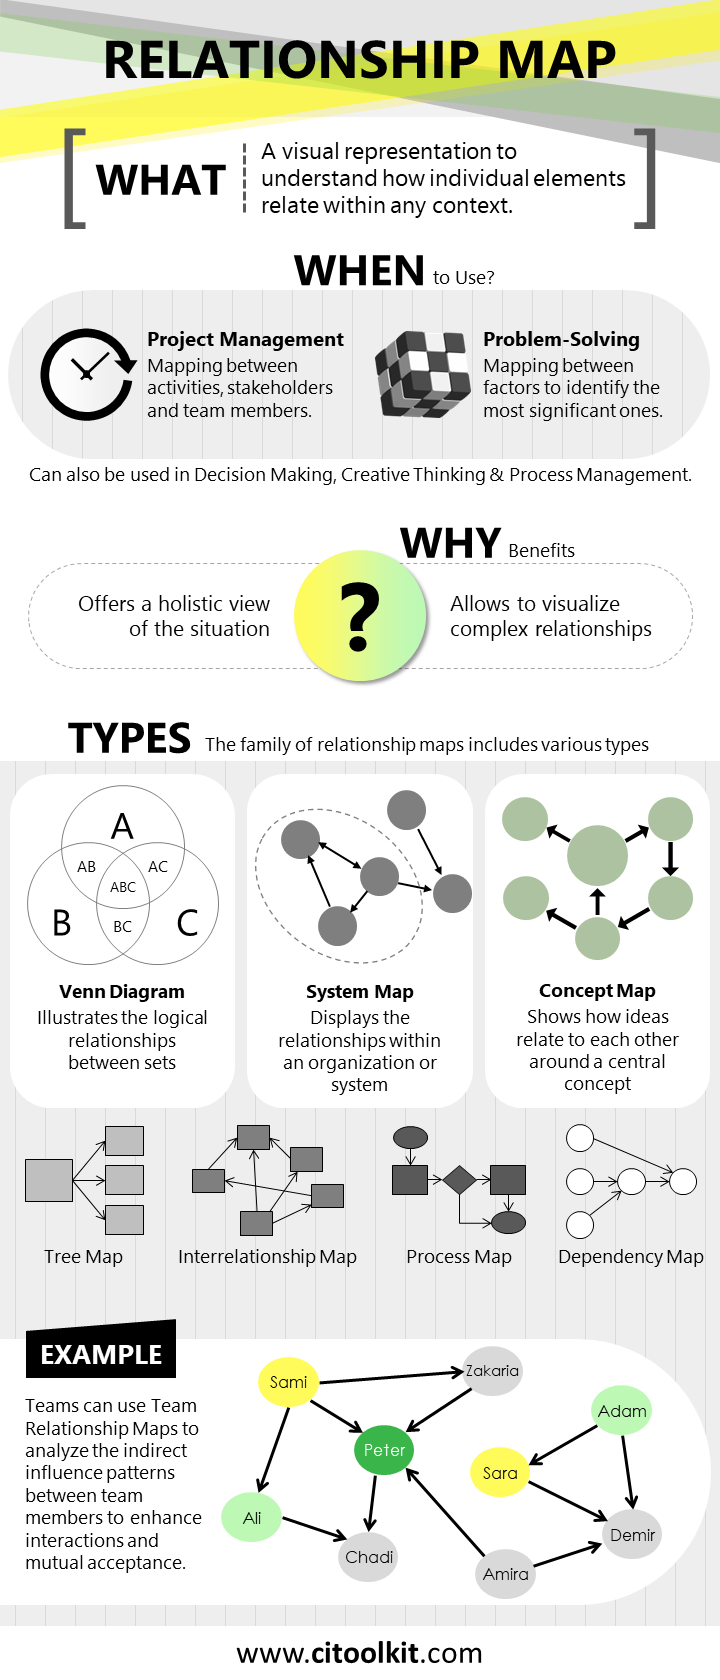
Relationship maps have many uses, especially in situations that don’t align into traditional hierarchical structures. They are often used in project management by mapping relationships between activities, team members, and stakeholders. Relationship maps are also useful during problem-solving efforts to help identify the most significant factors for improvement, using what is called the Interrelationship Diagram.
Unlike linear thinking, relationship maps encourage multidirectional exploration and allow the visualization of complex relationships. They offer a holistic view of the situation and help in understanding logical connections between ideas, factors, or issues. The family of relationship maps includes various diagram types described below, each depending on the nature of information and the goal of the analysis.
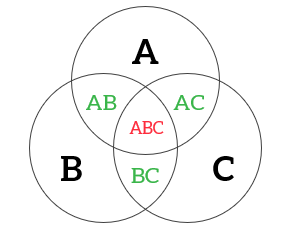
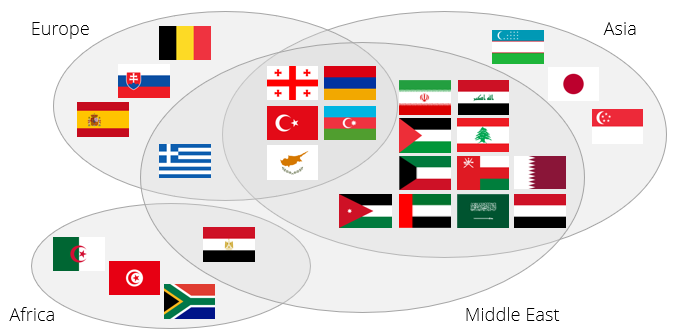
Venn Diagram
A visual representation that illustrates the logical relationships between sets. It uses closed curves or circles to represent the range of sets.
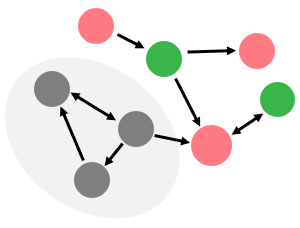
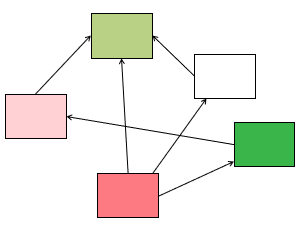
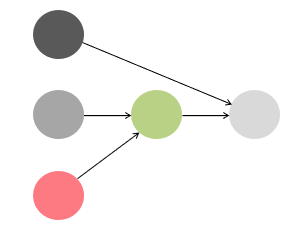
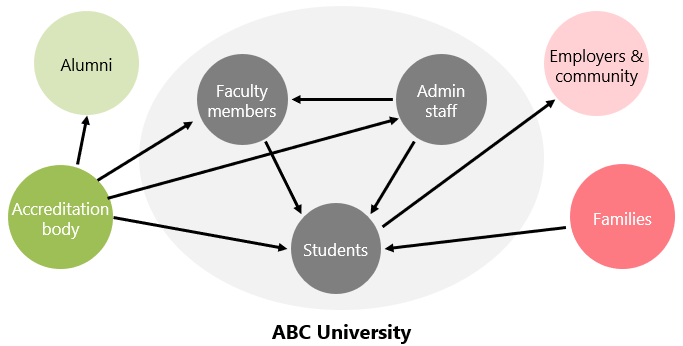
System Map
A visual representation that displays the relationships within an organization or system. It illustrates how the elements interact to achieve a specific objective.
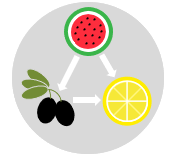
Concept Map
A visual representation that shows how ideas relate to each other around a central concept. It helps in organizing thoughts and simplifying complex information.
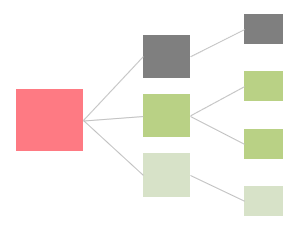
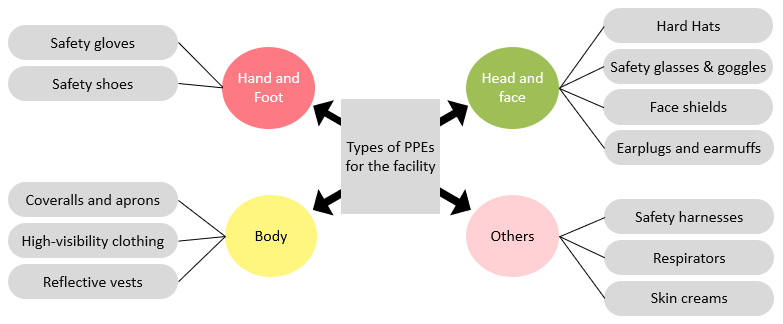
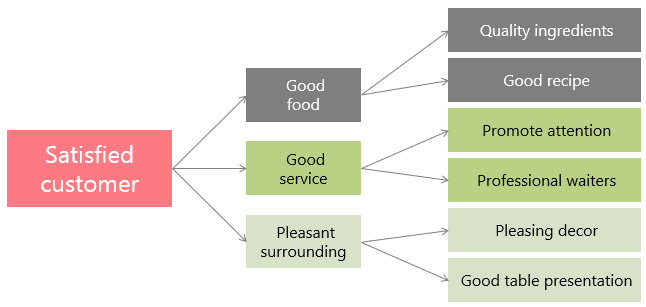
Tree Diagram
Illustrates hierarchical relationships among different elements. Examples of its applications include fishbone diagrams, fault tree diagrams and decision trees.
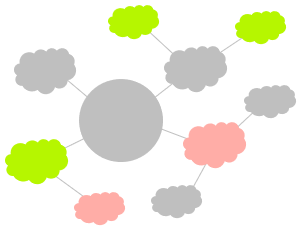
Mind Map
A visual representation for organizing ideas and thoughts around a topic or problem. Mind maps reflect the way human think and organize information.
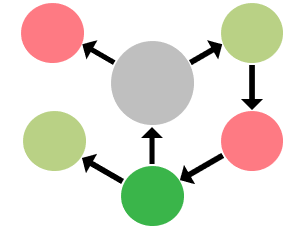
Interrelationship Diagram
A visual representation that displays the cause-and-effect relationships involved in a process or problem. It is one of the seven management and planning tools.
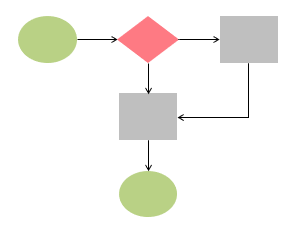
Process Map
A process map or flowchart illustrates the sequential and logical relationships among the different steps in a process within the context of process analysis.
Dependency Map
A visual representation that displays the connections between activities in a project or process. It helps in the identification and prevention of bottlenecks and delays.
In the information technology industry, several relationship maps are used to visually represent and understand complex IT connections and structures. For example, network diagrams show the components that make up a computer network and how they interact. Other examples include system architecture diagrams, database relationship diagrams, IT workflow diagrams, and cloud and security infrastructure mapping. These visuals support IT professionals in system design, optimization, troubleshooting, and overall IT management.
Relationship maps are highly useful in team and collaborative environments. They help in understanding communication patterns and promote more collaborative interactions among teams and team members. For example, collaboration maps visually represent the connections within an organization and across different departments or projects, while team relationship maps focus specifically on team interactions in order to enhance communication and collaboration.
In personal life, relationship maps provide visual ways to understand and strengthen connections with family and friends. For example, you can use your social network map to analyze your relationships and identify where to ask for guidance or seek support.
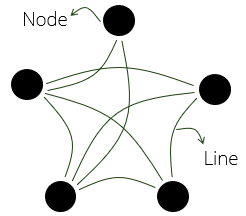
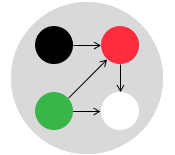
Typically, the exercise of relationship mapping follows an idea generation or data collection activity. These maps mainly use nodes and lines to represent the connections between elements. Each node can be linked with one or more nodes to indicate a direct relationship. The lines can indicate various types of relationships and can be in any direction. Additionally, line thickness can be adjusted to indicate the strength of the relationship.
Wrapping Up
Whether you are mapping your personal or professional connections, relationship maps are simple and helpful tools for understanding our interconnected world. These visual representations have a wide range of applications across various industries and functional areas. Relationship maps are particularly beneficial in team environments as they help in understanding communication patterns and promote collaboration among individuals and teams.
References
Rob, M. Crown Holdings. Process Improvement Program.
Other Formats
Slides
Poster
Infographic
Do you want to use the slides in your training courses?
Relationship Map Training Material: $15.85
Related Articles


