Check sheets are manual data collection forms used to collect data in real time at the location where the data is generated. They can be used on a temporary basis (for example during a project) or be established for routine activities. They enable faster capturing and compiling of data, allow the data to be recorded in a consistent manner, and enable capturing essential contextual and descriptive information that otherwise may be overlooked or forgotten.
Check sheets are often used for collecting failure information at specific process steps. These are often referred to as Failure Check Sheets. There are also the Visual Check Sheets (or the Measles Charts) that use pictures of the process or product to record where an event occurred. These are also known as a defect maps or a measles charts. A Traveler Check Sheet stays with the product or service throughout the entire process, collecting information at each stage. It is often used when collecting process lead times. Other common forms of check sheets are: Tally Charts and Checklists.
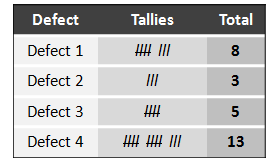
Tally Charts
A Tally Chart is an easy and helpful way to track and record data. It is a table that records the frequency with which different events are observed. The collected data is quickly understood as it is displayed in an easy-to-count groups of five. Tally charts are often used to capture data related to customer complaints, or when counting the defects produced by any single machine.
Checklists
A checklist is a basic check sheet with even more structure. It is simply a list of tasks to be performed and includes small check boxes next to each task. Listed items are ticked off as they are executed or when they are available. One of the benefits of checklists is that they compensate for the limitation of human memory and attention. Common examples of checklists are: to-do lists, preventive maintenance schedules, safety checklists and 5S checklists.
Measles Charts
Measles charts are practical visual tools for collecting data. They simply show the failures or events on a drawing or a picture. They help analyzing the location and the density of failures or events in a product or a process. They answer the question: “where the failures are located” or “where the events took place?”. Common examples of measles charts are: defect locations in a product, and the most confusing sections in a returned application.
Constructing a Check Sheet
Check sheets are easy to design and use. It is recommended that you design the check sheet with the team who are going to use it. The following steps explain how to construct a check sheet:
- Specify the data to be collected and the factors to be included.
- Determine the appropriate time period to collect the data.
- Simply list the issues you are tracking and leave space to allow writing whenever someone finds an issue or failure.
- Add columns as needed for other data, such as delay times, defects, etc.
- Try it first. Pilot test the check sheet and make changes as needed.
- Encourage recording contextual data for tractability (dates, names, etc.).
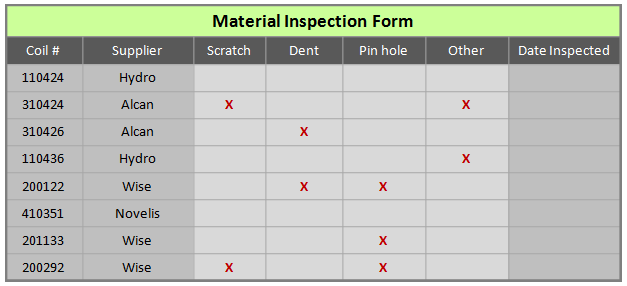
Example – Incoming Material Inspection Form
The following is an example of an incoming material inspection form in a manufacturing organization that receives aluminum coils from different suppliers.
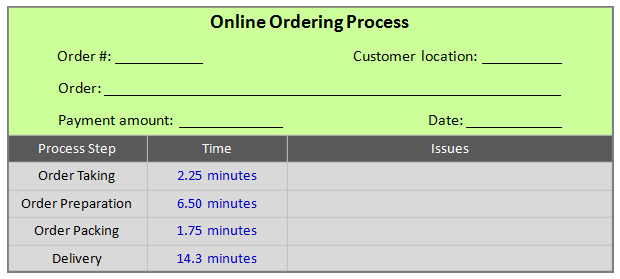
Example – Traveler Check Sheet
The following is an example of a traveler check sheet for an online ordering store.