Also known as Material and Information Flow Analysis and Value Stream Analysis.
A Value Stream Map (VSM) is a high-level visual representation of a business process. It helps to understand the flow of value through the process as perceived by the customer. The primary goal is to identify and eliminate waste and make the process as close to Lean as possible. Although it is often associated with manufacturing, it has wide applicability beyond manufacturing and can be applied in service environments such as healthcare, hospitality and logistics.
A value stream map serves as an improvement tool rather than just a definition of how the process operates or should operate. It is a dynamic tool that requires continuous updates as the process evolves. Unlike typical process maps or flowcharts, VSM provides more comprehensive information. However, a value stream map does not track all possible paths and decisions within a process. It focuses exclusively on the high-level flow of value from start to finish.
So What is a Value Stream?
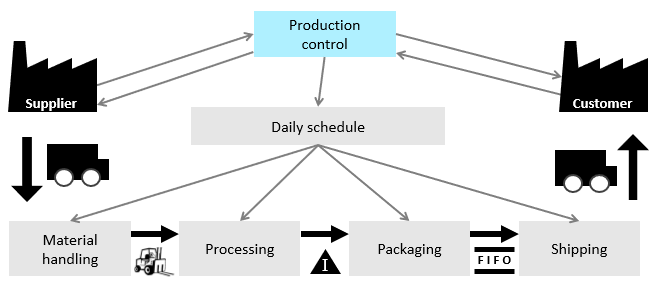
A value stream is the set of activities required to convert raw materials to finished products in the hands of the customer. It spans from the event the materials are received from the supplier until the finished products are delivered to the customer. It includes other functions such as order-taking, order communication and detailed scheduling. Examining the value stream helps identifying waste and non-value-added activities, and this is the aim for using a value stream map.
Material and Information Flows
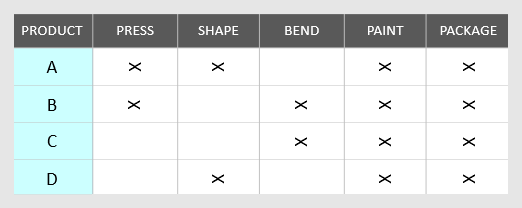
A value stream map analyzes both material and information flows. A material flow is where products flow through the stream and normally includes activities such as processing, handling, transporting and storing. To simplify the mapping process, it is not necessary to map the flow of every product, but rather focus on a single product or product family with high volumes or significant business impact.
A product family matrix is often useful for choosing the product to be mapped.
What makes the value stream map unique is the representation of information flow along with the material flow. An information flow plays an important role in effectively controlling the material flow and executing the process in general. Information flows may include activities such as forecasting, ordering, scheduling, approving, reporting, replenishing, communicating, evaluating, and any other actions necessary to support the process.
Current and Future States
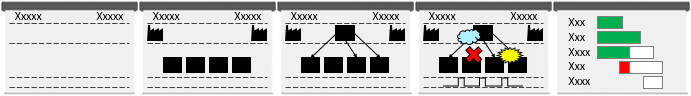
The value stream mapping process begins by defining the current state as it is today, providing a clear picture of the existing operation. This allows the identification of waste and areas for improvement. Once the current state is mapped and waste areas are identified, attention can be shifted towards designing the future state, which outlines how the process should ideally operate.
A future state represents the ideal state or blueprint for implementing a more Lean operation. Thus, it should be based on Lean principles such as flow, pull and perfection to create a more streamlined production flow. It is important, however, to define what is meant by “future” before developing the future state.
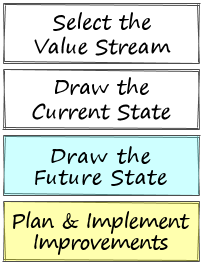
An implementation plan should then be developed to get to the future state taking into account the gap between where we are now and where we want to be. This plan should incorporate key elements such as milestones, review periods, responsibilities, and actionable steps. It is essential to treat this endeavor as a project that needs to be owned, tracked and monitored throughout its lifecycle.
Once the desired future state is successfully achieved, it becomes the new current state and the process should start all over again, and this is the essence of continuous improvement.
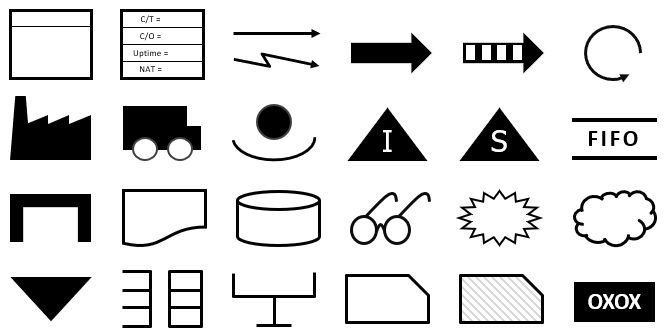
VSM Symbols
Value stream mapping uses a set of symbols to denote various VSM details. The type of symbols used generally depends on the industry and type of work. While the following listed symbols are universally recognized, custom symbols can be incorporated to convey the unique attributes of your business. However, it is important to ensure that these symbols are simple and understandable to all stakeholders.
The following are the basic symbols that are applicable in almost every situation:
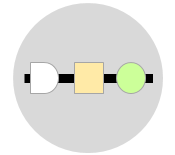
Text box – Covers one area of continuous flow, where materials flow without being stored, queued or delayed.

Information flow – Generally used to represent flow of information, and can be accompanied with text or other icons.

Material flow – Represents the transfer or movement of materials from one process to the next.

Material withdrawal – Used when the material is pulled from the supplying process to the supplied process.

External body – Represents an external body to the organization. Mainly indicates key suppliers and key customers.

Worker – Usually placed in a process box to represents the number of workers deployed at a particular workstation.

Transport – Represents how raw materials are brought in and how finished goods are sent out the organization.
Inventory – Represents the storage locations for raw materials, work-in-process (WIP), and finished products throughout the value stream.

Go see – Visually checking material and information flows to ensure they meet quality standards and quantity requirements.

Kaizen burst – Used to indicate issues and problems throughout the value stream.

Data Boxes
Data boxes can be optionally used to outline key information related to processes, transportation, inventory, key customers, and key suppliers. These data boxes can be useful during the creation of the value stream timeline, the value stream summary box, and when comparing different workstations or processes. Below are examples of the data and metrics that can be included within the Supplier, Process, Customer, Transportation, and Inventory data boxes.
Supplier data box
- Number of suppliers
- Demand rate (items/day)
- Packaging size requirement
- Actual and required lead times
- Error rates
- Supplier shift pattern
- The different types of materials
- Shipping frequency
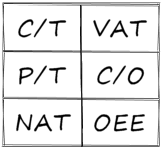
Process data box
- Cycle times (C/T)
- Changeover times (C/O)
- Net available times (NAT)
- Defect or scrap rates
- Machine uptime rates
- Production rates or EPE
- Processing times
- Setup times
- Workers per workstation
- Batch sizes
- Maximum capacities
- Number of product variations
Customer data box
- Number of customers
- Demand rate (items/day)
- Packaging size requirement
- Actual and required lead times
- Error rates
- Customer shift pattern
- Product mix
- Shipping frequency
Transport data box
- Distance traveled
- Transportation time
- Transportation frequency
- Number of product types
Inventory data box
- Inventory type
- Amount of inventory
- Queue or delay time
- Number of product types
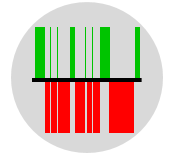
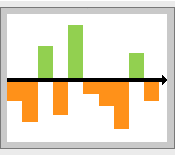
Value Stream Timeline
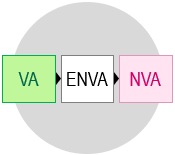
In order to get the most of value stream mapping exercise, it has to be summarized using a single metric, and this metric needs to be improved continually. Many organizations adopt the Value-Added Ratio (VAR) metric to assess the performance of their end-to-end process.
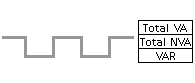
VAR = Total Value-Added Time (Processing Time) / Total Lead Time
A value stream timeline is used to facilitate the calculation of VAR. This timeline represents the time spent across all stages in the format of ‘hills’ and ‘valleys’. The hills represent the waiting non-value-added time whereas the valleys represent the processing value-added time. It is important to note that not all processing time is value-added. Typically, the results are summarized at the right-hand side of the timeline in a summary box. Additional metrics can be included in the summary box as required.
Conducting a VSM Exercise
The following are key steps involved in constructing a value stream map:
- Establish the team and include people working in the process.
- Clearly explain the purpose for creating the value stream map.
- Identify and agree on the product family and the value stream.
- Physically walk the flow starting from the customer and working backwards.
- Capture all relevant data and performance information as you walk.
- Walk the information flow and collect examples of relevant records.
- With your team, use a flipchart or whiteboard to draw the current state.
- Map the material flow including processes, inventory, delays and transportation.
- Map the information flow and the secondary processes.
- Add the value stream timeline and calculate value stream summary metrics.
- Look for the non-value-added activities, delays and other form of waste.
- Visualize the ideal state and develop the future state map.
- Plan and implement actions to achieve the future state.
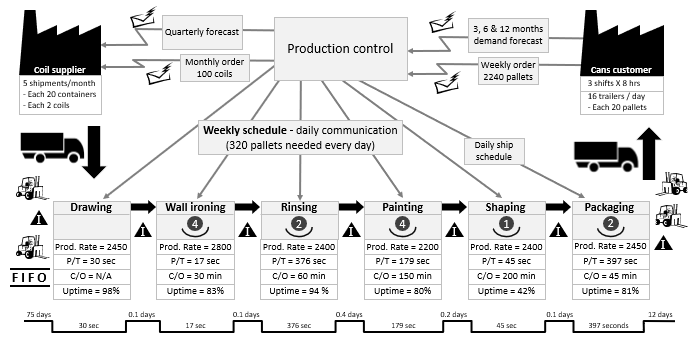
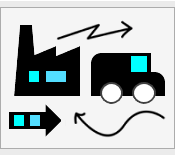
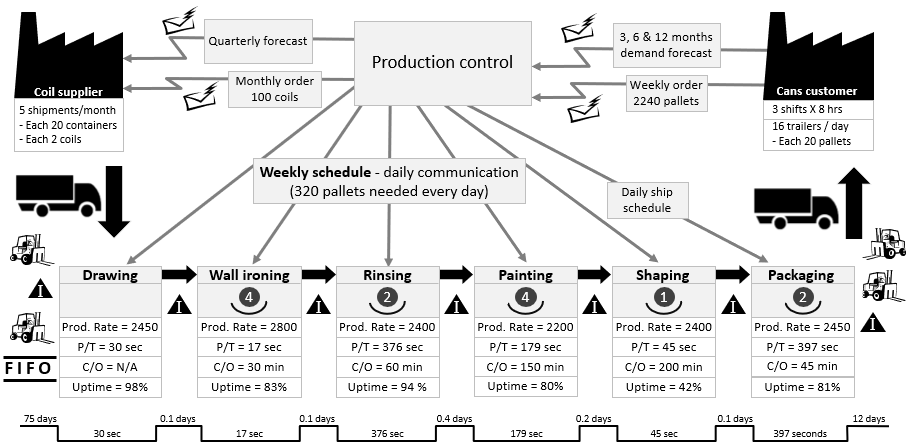
Example – Manufacturing
Presented below is an actual example of a value stream map created for a specific product family within a manufacturing facility. This current state value stream map was developed as a result of a real team exercise.
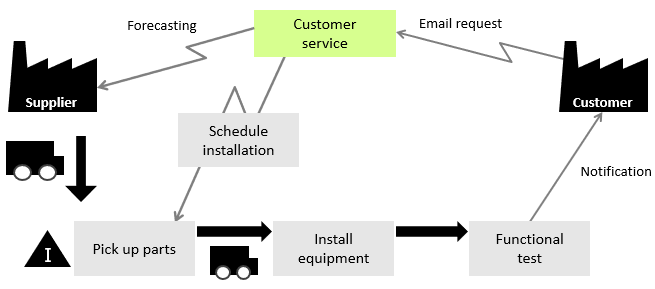
Example – Non-Manufacturing
This is an example of a value stream map specifically designed for a non-manufacturing process, namely equipment installation.
There are many software applications and online services that allow the creation of value stream maps. For example, Minitab Workspace offers functionality for creating value stream maps. Alternatively, you can use the provided template, which offers a user-friendly approach.
Wrapping Up
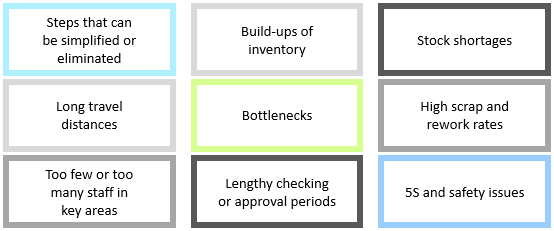
By facilitating the identification of waste and non-value-added activities, a value stream map helps identifying opportunities for waste reduction and performance improvement. It can effectively communicate where to focus the continuous improvement efforts to deliver more value. It enables to see where problems and inconsistencies lie within processes such as non-value-added activities, delays, bottlenecks, and excessive inventory levels. This in turn will provide the opportunity to discuss and plan improvement actions before delivering products or services to the customer.
Other Formats
Do you want to use the slides in your training courses?
Value Stream Map Training Material – $22.85
Related Articles
Related Templates
