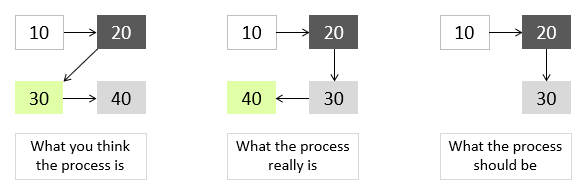
Process maps are used to map existing processes (what the process really is), as well as to map the future state of how things should be after implementing process improvement (what the process should be).
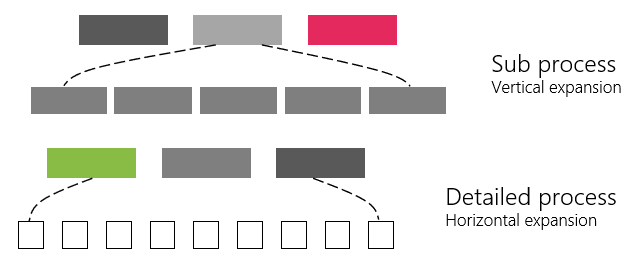
Just like real maps, process maps can be created in different levels (vertical expansion). Also, the process itself can be as simple or as complex as required (horizontal expansion).
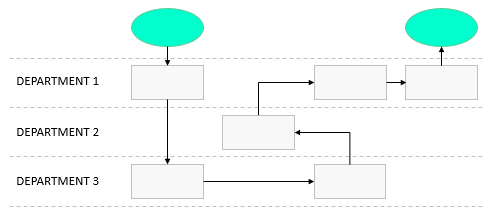
A cross-functional flowchart (or a swimlane flowchart) illustrates the sequence of activities required to accomplish a cross-functional process.
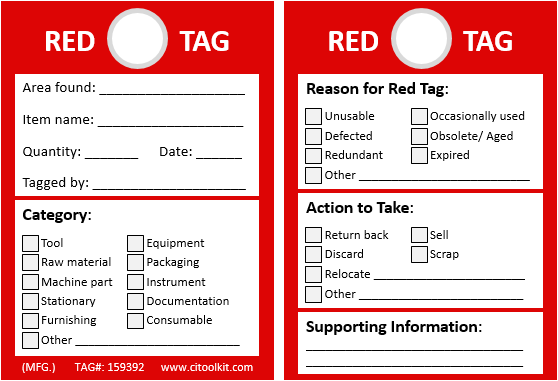
The use of a red tag as a labeling tool in the Sorting phase in 5S.
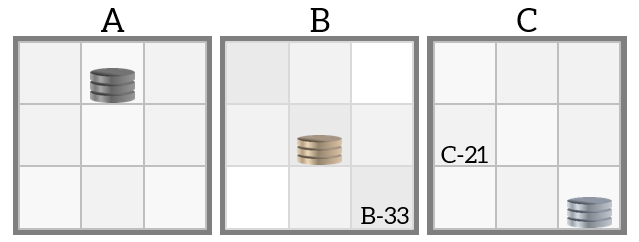
The use the three-point identification system in 5S (rack-row-column). You may also include aisles in the identification.
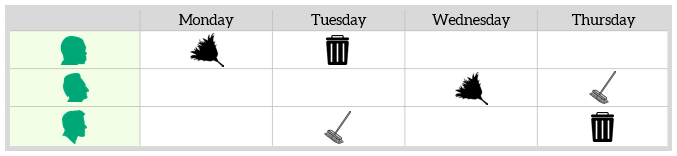
The use of a duty schedule in 5S to show which tasks must be performed, when, and by whom.
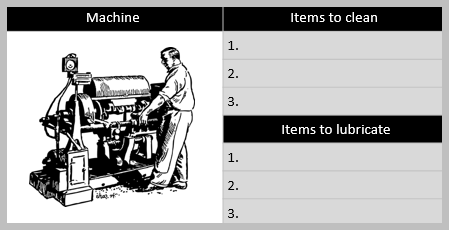
A Machine cleaning/lubrication check sheet is an example of standardization in 5S.
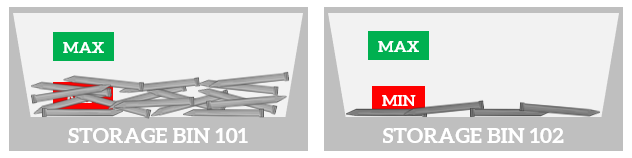
The use of colors and labels to define inventory levels and reorder triggers.
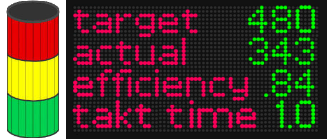
Andon display uses traffic light signals to communicate production information on the shop floor.
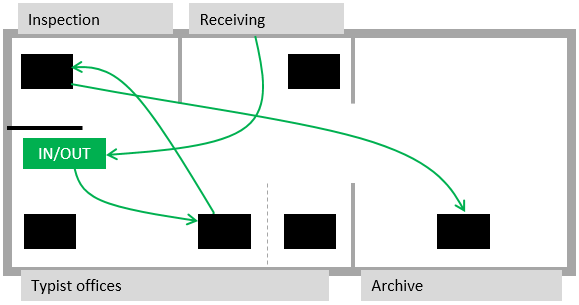
This flow diagrams illustrates the movement of a document after received until it is sent to the archive.
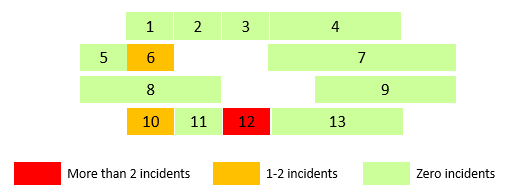
A map that uses the traffic light colors to indicate the areas which have the most safety incidents resulted in lost time.
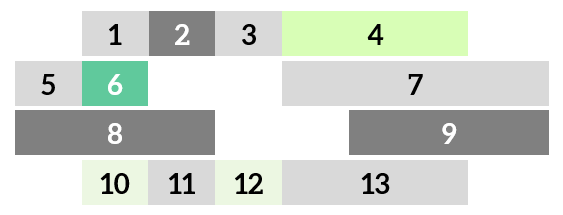
Dividing the workplace into zones in 5S and allocate people to take charge of each zone.
brainstorming can be used during all phases of the DMAIC methodology.
Questionnaires can be used during all phases of the DMAIC methodology.
Interviews can be used during all phases of the DMAIC methodology.