This library provides a visual journey to enhance your learning experience. We believe in the power of combining visual learning with other learning methodologies. Here, you’ll find a collection of illustrations and figures from our Articles section, each designed to transform complex concepts into clear, visual narratives.
Let these illustrations guide your pursuit of knowledge. Feel free to save, share, or pin them to your Pinterest for future reference.
Illustrations Gallery
Mistake-proofing is built on principles designed to prevent, detect, or control errors in processes and products.
This is an overview of how each of the key mistake-proofing principles aligns with specific types of Poka-Yoke in order of best suitability.
Interviews have a wide range of applications in both business and non-business contexts
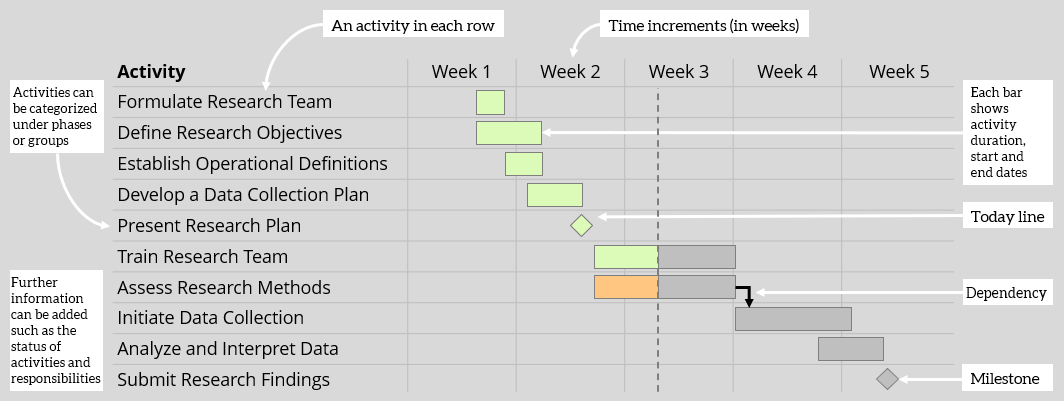
This Gantt chart illustrates all the tasks for a research project, highlighting the essential components of a Gantt chart.
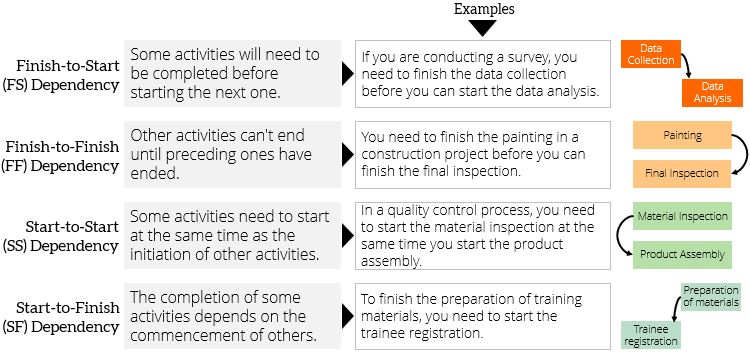
Gantt charts can show the dependency relationships between activities. This illustration clarifies the different types of dependencies.
An improvement roadmap template in its simplest format contains only four sections (improvement categories, current condition, milestones and targets, and performance metrics).
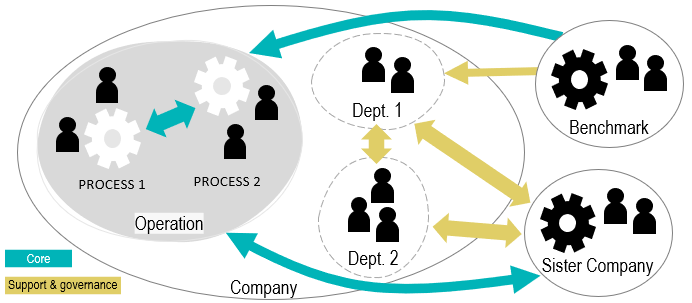
Yokoten is a two-way exchange of best practice information between two or more entities and can be a powerful tool for driving world-class performance.
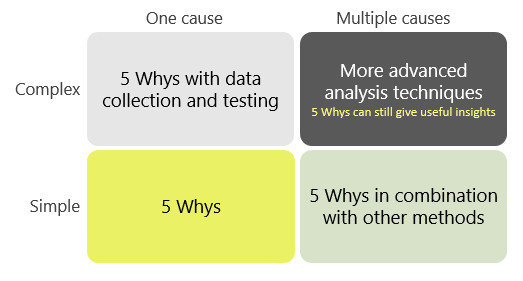
5 Whys is most effective when used to solve simple to moderate problems.
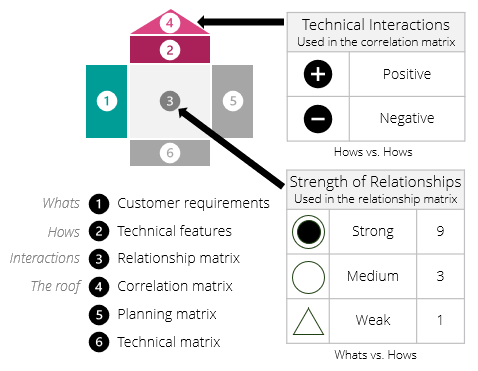
There are many versions of the House of Quality. These are the most common building blocks and symbols used in the House of Quality
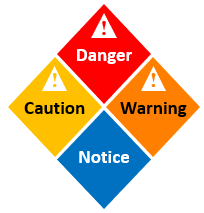
Safety visuals often use bright coloring to attract attention.
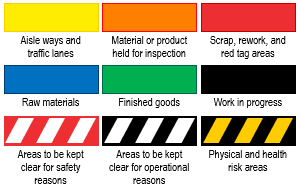
Floor marking is used to improve the layout of the workplace and mark critical safety and security areas.
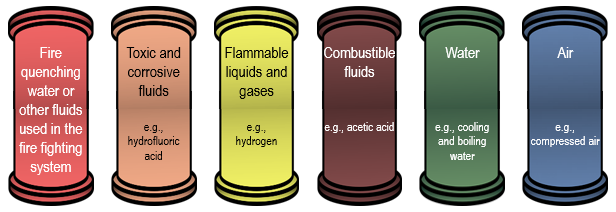
Pipe marking communicates all the necessary information about the pipelines including the content, direction and flow rate. Arrows are used to indicate the flow direction while colors often indicate the nature of the content.
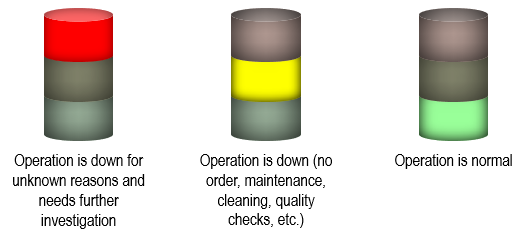
Andon lights are powerful visual tools which are installed on production machines to indicate their current status. They are very useful in bringing immediate attention to problems as soon as they arise.
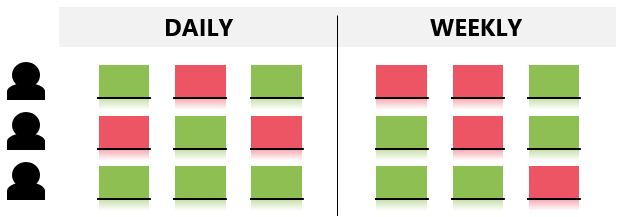
A basic Kamishibai board consists of a board and multiple cards that display specific activities to be performed.
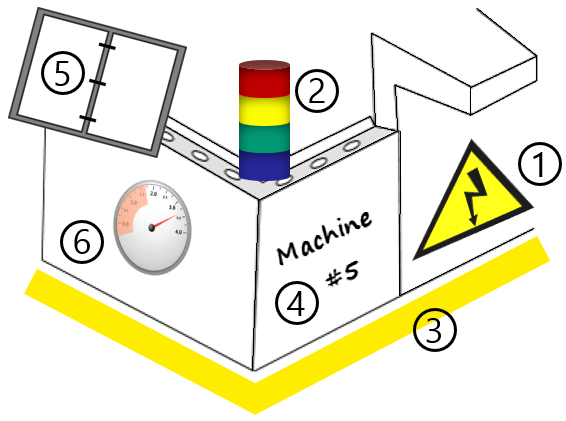
Example of visual management in a production line. 1. Safety sign 2. Andon lights 3. Floor marking 4. Machine identity 5. Visual instructions 6. Gauge marking.