Continuous Improvement Toolkit
Effective
Tools
for Business and Life!
Search
Libraries
Articles
Templates
Slides
Posters
Infographics
Examples
Exercises
Maps
CI Map
Lean Tools Guide
Yellow Belt Guide
Green Belt Guide
Black Belt Guide
PMBOK Tools
Change Tools
DMAIC Process Guide
Basic Quality Tools
Blog
Shop
Category:
Decision Making Templates
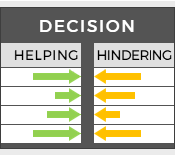
Force Field Analysis Template
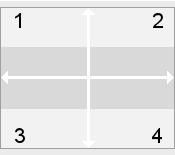
Four Field Matrix Template
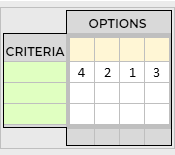
Prioritization Matrix Template
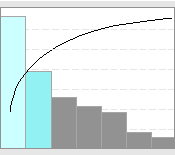
Pareto Chart Template
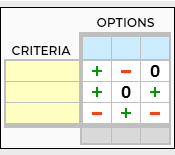
Cause and Effect Matrix Template
Matrix Diagram Template
Cost Benefit Analysis Template
Project Selection Template
Quality Function Deployment Template
Pugh Matrix Template