- Time to Read:
Also known as Project Bar Chart.
Related topics include Milestone Chart, Progress Chart, Action Plan, Implementation Plan Timeline Chart and Hammock Activity.
When managing projects, a large number of activities must be controlled and completed on time. Missing deadlines is significant and may result in increased costs and penalties. That’s why project scheduling and allocating time to each activity are important. Project managers need to estimate the duration of each activity and assign responsibilities for each project phase. Leveraging Gantt charts proves to be very effective in managing projects of any kind.
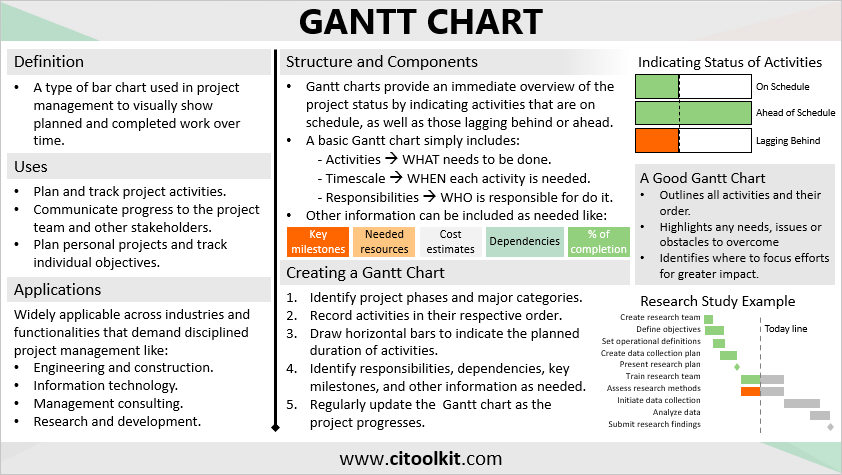
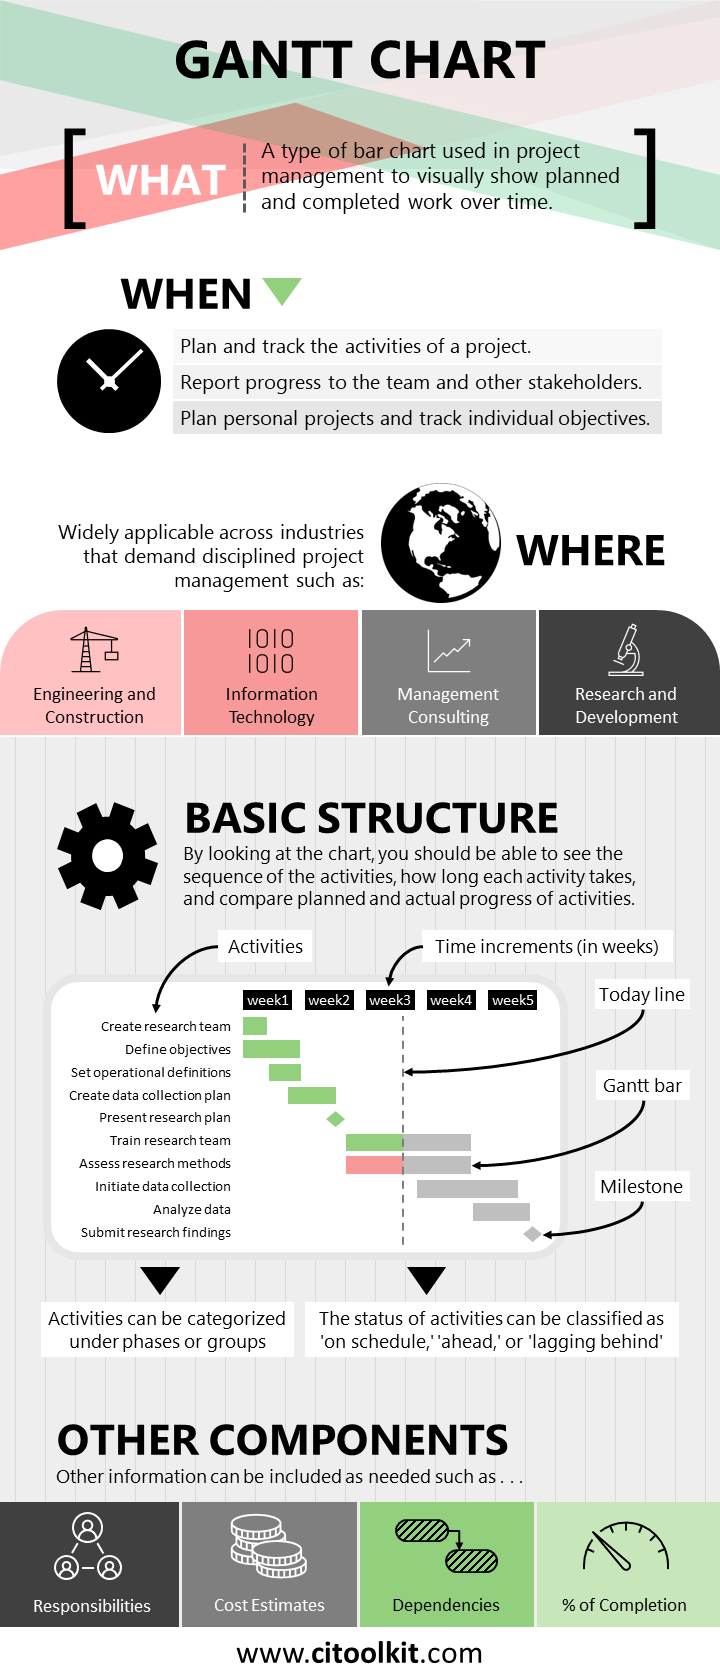
A Gantt chart is a type of bar chart used in project planning to visually show planned and completed work over time. It is a great way to manage project schedule and display activities and milestones in a clear way. It also serves as communication tools by showing the team their progress and keeping management informed about the overall progress. Gantt charts are widely applicable across industries that demand disciplined project management like construction, engineering, information technology, research and development, and management consulting.
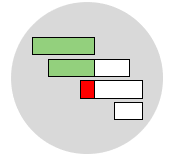
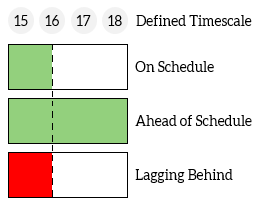
Gantt charts are used early in the project to identify and plan activities and their expected durations. They are also useful throughout the project for monitoring progress, tracking developments, and identifying issues that may cause delays. They provide an immediate overview of the project status by indicating activities that are on schedule, as well as those lagging behind or ahead.
Gantt charts can be used in personal project planning and tracking individual objectives. For example, you can use it for things like planning your fitness goals or organizing your home renovation.
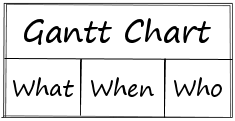
A Gantt chart can be presented in various formats and may include multiple components. A basic Gantt chart simply lists what needs to be done, when it is needed, and who should do it. Other information can be included as needed such as key milestones, needed resources, cost estimates, relationships and dependencies between activities, and indicators or shading to show the progress of activities.
Creating a Gantt Chart
Gantt charts can be manually drawn or created using spreadsheet applications. If more advanced features are required, project management software such as Microsoft Project can be considered. The following guidelines can assist in creating a Gantt chart using a spreadsheet application.
- Identify project phases and major categories. Consider using a Work Breakdown Structure (WBS) if the project is complex.
- Record activities in the order they need to be completed.
- Estimate start dates and durations for each activity.
- Draw horizontal bars to indicate the activities and their durations.
- Clearly assign responsibilities for each activity.
- Identify key milestones, dependencies, cost estimates and other relevant information as needed.
- Allocate necessary human and material resources.
- Regularly update the chart as the project progresses.
Note: Gantt charts should also be updated to reflect changes in time estimates as well as when adding or removing activities.
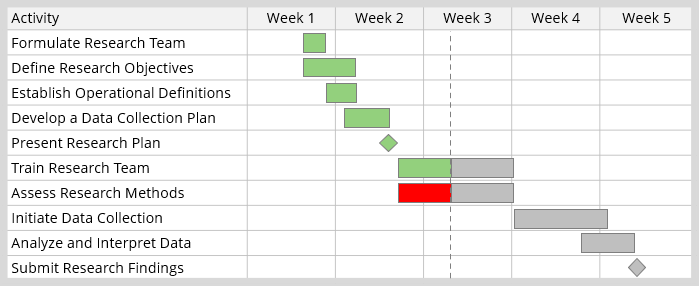
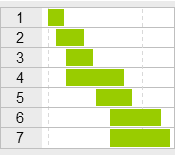
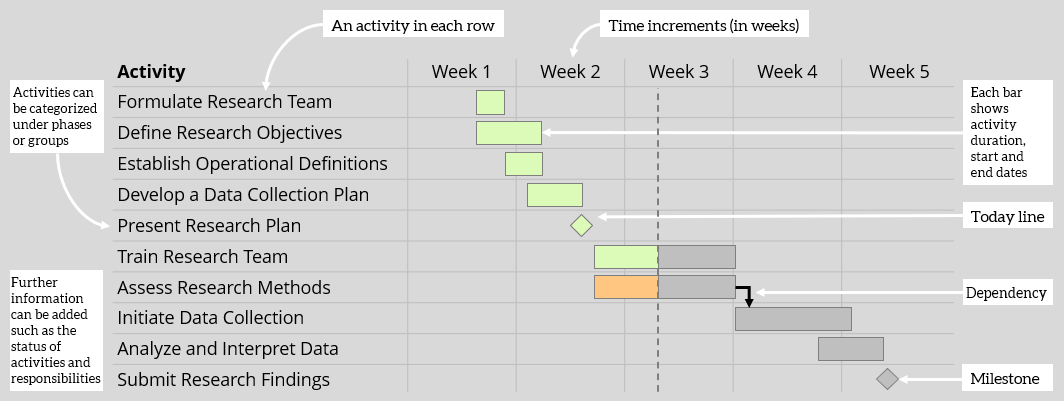
Example – Conducting and Completing a Research Study
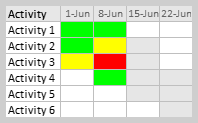
This is an example of a Gantt chart that outlines all activities related to a research project. Note that the vertical dashed line indicates the current date, and milestones are represented by diamond shapes.
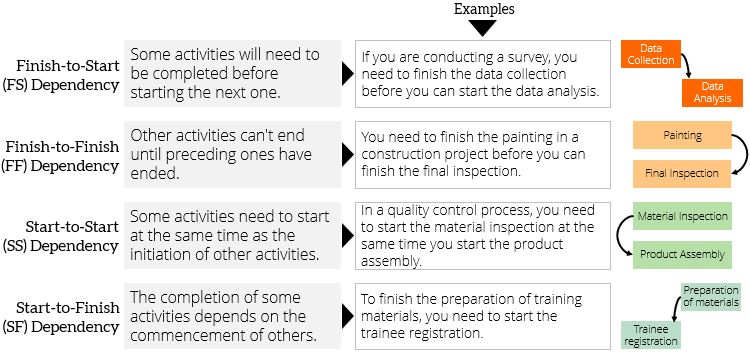
Dependencies
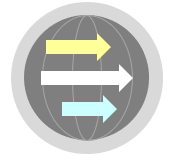
A Gantt chart can also show the dependency relationships between activities. Understanding dependencies helps project managers coordinate activities more effectively. Managing dependencies is important to ensure the smooth flow of work, avoid bottlenecks, and maintain the overall timeline of the project. In general, there are four main relationships between sequential activities: Finish-to-Start, Finish-to-Finish, Start-to-Start, and Start-to-Finish. The illustration below clarifies the different types of dependencies.
Project scheduling involves more than just creating a Gantt chart and managing dependencies. It includes various concepts essential for effective project planning and execution. Such concepts include but not limited to critical path, lead and lag time, activity slack, crashing and fast-tracking, and buffer management. This article offers as an introduction to Gantt charts, and for a more thorough understanding of project scheduling, it is recommended to explore additional resources.
There are many tools available to assist in the creating a Gantt chart. One of the simplest tools involves using this Gantt chart template.
Wrapping Up
Gantt charts are used to plan, track, and report the progress of any project. They are useful for scheduling project activities and help ensuring the project stays on course. Gantt charts are also effective tools for communicating progress to the project team and other stakeholders. They allow to see how the project is performing at a glance, help determining the needed resources, and allow to focus efforts and reacting quickly to unexpected situations.
These charts can include various details, such as the activities that need to be done, when, by whom, and key project milestones. They can be created manually, with spreadsheet applications, or using project management software like Microsoft Project.
References
Krajewski, L., Ritzman, L., Malhotra, M. Operation Management: Processes and Value Chains. Pearson.
Kubiak, T. M. The Certified Six Sigma Master Black Belt. Infotech.
Other Formats
Slides
Poster
Infographic
Do you want to use the slides in your training courses?
Gantt Chart Training Material: $15.85
Related Articles

Related Templates


