Blog
-
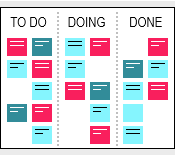
Kanban Board: Driving Better Workflow Through Visual Thinking
Also Known as Activity Board, Task Board, and Agile Board. Related topics include Scrum Board, Production Control Board, Kanban Order Board, Workflow Board, and Scheduling Board. A Kanban board is a simple tool that helps people and teams track their work and see progress…
-
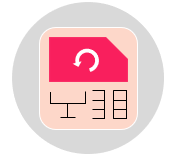
Kanban: A Simple System for Smarter Production and Inventory Control
Also Known as Signal-Based Production System and Flow Control System. Related topics include Two-Bin System, Three-Bin System, Reorder Point System, Min–Max Inventory System, FIFO. Traditional production systems work on a push basis. Products are made according to a fixed schedule rather than real customer…
-
Kaizen Event: Small Steps That Transform Workplaces
Also known as Kaizen Workshop, Kaizen Workout, Improvement Event, Kaizen Blitz, and Rapid Improvement Event. Related topics include Corrective Action Event, Quality Cycle, and Focus Group. What is a Kaizen Event? A Kaizen event is a short, focused activity where a team works together…
-
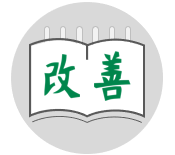
Kaizen: Good Change Every Day
Also known as Kaizen Program, Good Change and Continuous Improvement. Kaizen is a Japanese idea that means making small, steady improvements every day. Instead of waiting for big changes, Kaizen focuses on fixing little things that add up to big results over time. This…
-
Thinking Ahead: How FMEA Keeps Processes Safe
Also Known as Failure Analysis. Related topics include Risk Analysis, Failure Tree Analysis, Fault Tree Analysis, and reliability Analysis. FMEA, which stands for Failure Mode and Effects Analysis, is a team-based method used to spot and prevent problems before they happen. It is a…
-
Best Practice Template
The aim of documenting best practices is to capture creative, effective, and innovative solutions to common challenges within the company. By systematically sharing these solutions, companies can promote Lean and continuous improvement, reduce waste, improve efficiency, and enhance overall operational performance. Best practices serve…
-
Gap Analysis Template
A gap is a problem, issue, or challenge, and can also represent an opportunity for improvement. Gap analysis is a structured method used to examine the difference between two deferent states of a process, system, or performance indicator. This gap analysis template enables teams…
-
Waste Analysis Template
Waste analysis is a core component of Lean thinking. It focuses on the identification, quantification, elimination, and long-term prevention of activities that do not add value. This Waste Recording and Tracking Template offers a structured approach to log and track various types of waste…
-
5W1H Analysis Template
5W1H Analysis is a simple and effective tool used in problem-solving and Lean thinking. It helps teams understand any problematic situation by looking at six key questions: What, Who, Where, When, Why, and How. This tool complements other problem-solving methods, such as the 5…
-
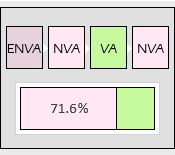
Value Analysis Template
Value analysis is a foundational element of Lean thinking. It focuses on how each process step contributes to what truly matters to the ultimate customer or end user. This value analysis matrix template provides a structured way to examine every activity within a process…
-
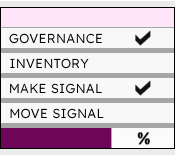
Kanban Audit Checklist
The Kanban Audit Checklist is a comprehensive tool designed to evaluate the maturity and effectiveness of Kanban system implementation within any facility, including manufacturing, warehousing, service, or support operations. Its primary objective is to assess how well the Kanban system supports Lean, Pull and…
-
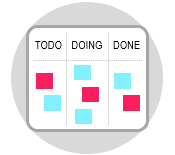
Kanban Board Template
A Kanban board is a practical tool used for both project and process tracking. It offers a clear visual view of work as it moves from one phase to another. By breaking activities into steps and displaying them on a board, teams can instantly…