Also known as Interrelationship Diagraph and Interrelationship Map.
Variants include Influence Diagram.
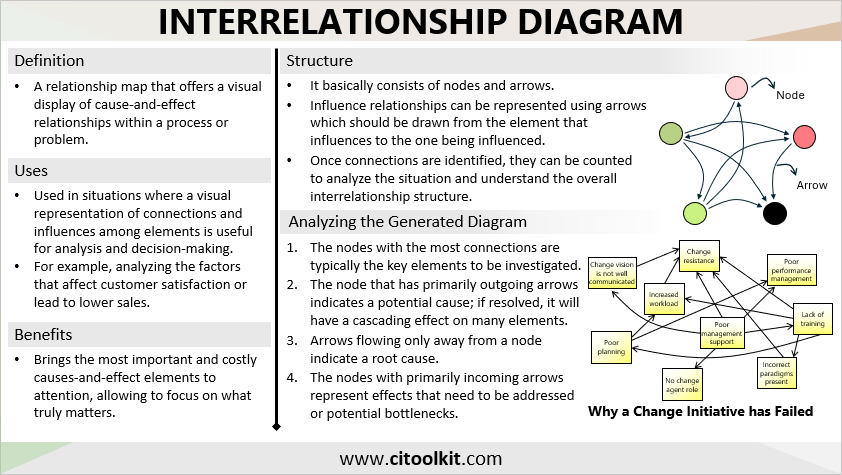
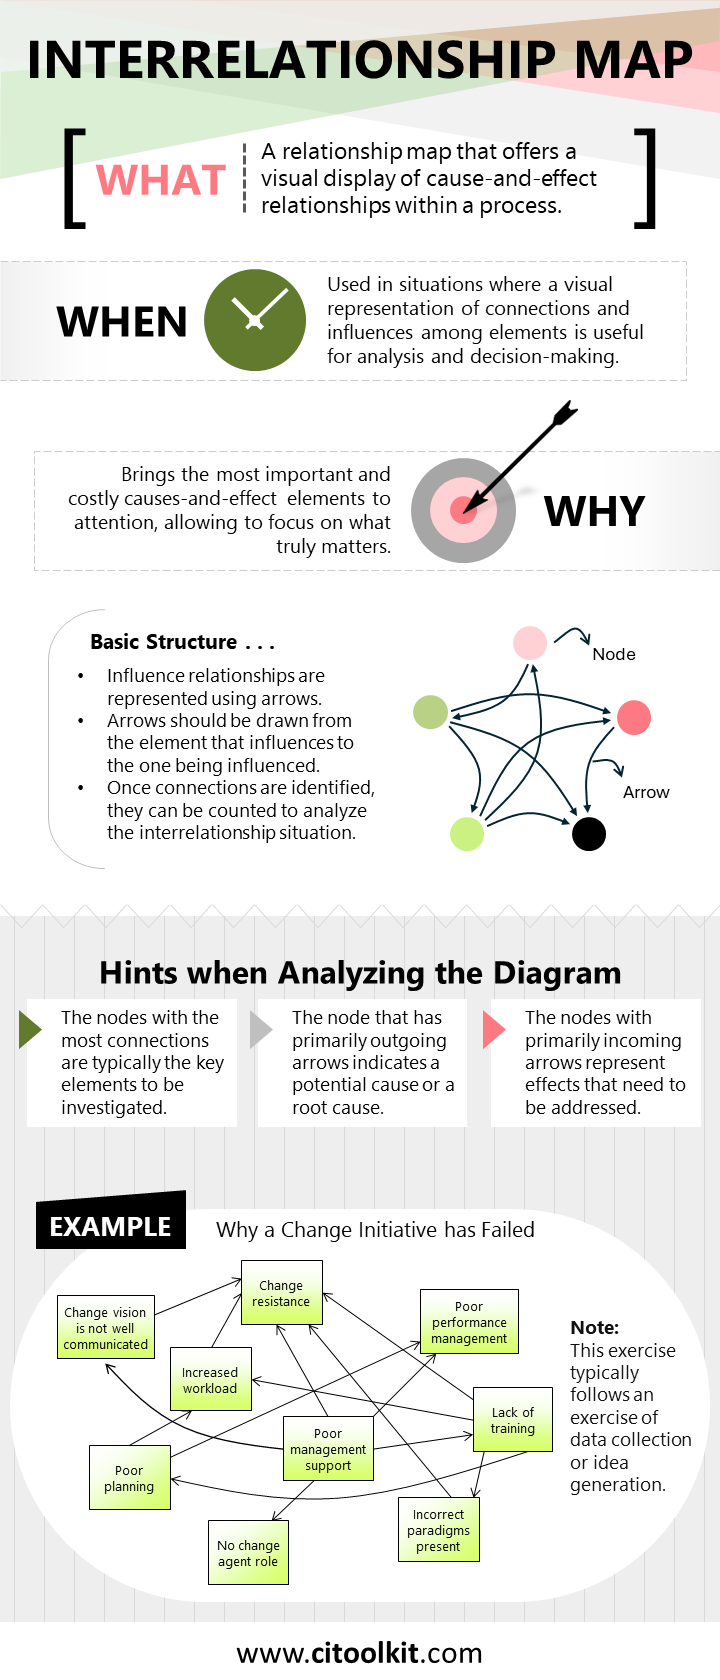
An Interrelationship Diagram is a relationship map that offers a visual display of cause-and-effect relationships within a process or problem. It provides insights into the complexities of a given As-Is process and illustrates the relationships among the different cause-and-effect elements. This type of diagram is widely used in problem-solving scenarios to identify the ideas and factors that have the greatest impact for resolution. The interrelationship diagram is one of the seven management and planning tools that is important for making confident and rational decisions.
Interrelationship diagrams can be applied in situations where a visual representation of connections and influences among elements is useful for analysis and decision-making. For example, analyzing the factors that affect customer satisfaction or lead to lower sales in a company. These diagrams bring the most important and costly causes-and-effect elements to attention, allowing to focus on what truly matters.
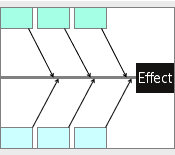
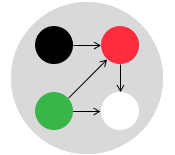
An interrelationship diagram is basically a network that consists of nodes and arrows. Influence relationships can be represented using arrows which should be drawn from the element that influences to the one being influenced. If two elements influence each other, the arrow should be drawn to reflect the stronger influence. Once connections are identified, they can be counted to analyze the situation and understand the overall interrelationship structure.
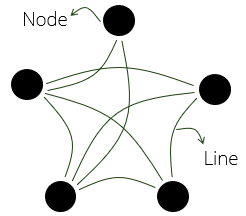
When analyzing the generated diagram, consider the following points:
- The nodes with the most connections are typically the key elements to be investigated and can be highlighted in some way, such as using double borders or color highlighting.
- The node that has primarily outgoing arrows indicates a potential cause; if resolved, it will have a cascading effect on a large number of items.
- Arrows flowing only away from a node indicate a root cause that should be addressed to resolve the problem.
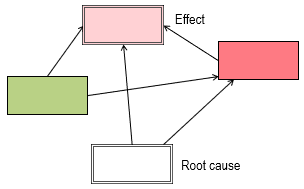
- The nodes that have primarily incoming arrows flowing into it are effects that need to be addressed. This may also indicate a bottleneck that is difficult to resolve due to the multiple contributory causes.
Constructing an Interrelationship Diagram
An interrelationship diagram typically follows an exercise of data collection or idea generation. Data may be gathered through methods such as affinity diagrams, cause and effect diagrams, or tree diagrams. The following steps explain how to construct an interrelationship diagram:
- With your team, clearly explain the purpose for constructing the interrelationship diagram.
- Brainstorm or collect the problem elements to be interrelated on the diagram.
- Write these elements on note cards then place them on a flipchart or whiteboard.
- Explore the connections of each element, then draw arrows to indicate causation or influence.
- Repeat this process until all elements are reviewed.
- Count the number of incoming and outgoing arrows then write the totals beside each element.
- Analyze the diagram by identifying and marking those elements that are likely to be the real causes of the problem.
- Plan and implement actions to solve the problem.
Example
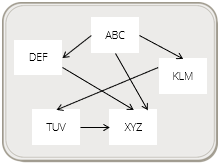
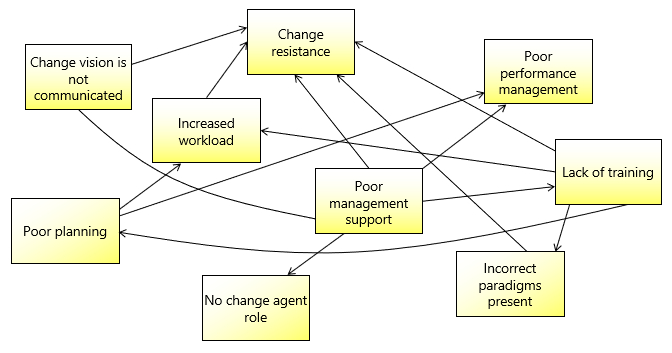
The following ideas were collaboratively developed by a team to identify the reasons why a change initiative within a company has failed to bring the anticipated benefits.
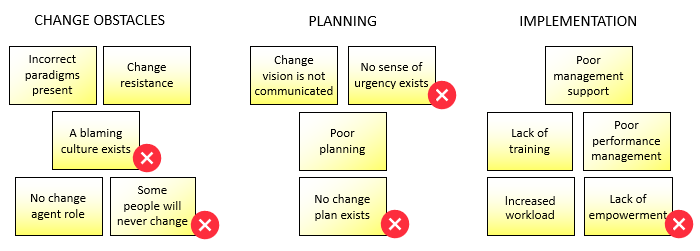
After careful consideration, some ideas were removed. The following is the interrelationship diagram created by the team after exploring the connections among the remaining ideas.
The following is an organized version of the previous diagram where the totals of the incoming and outgoing arrows are written beside each item.
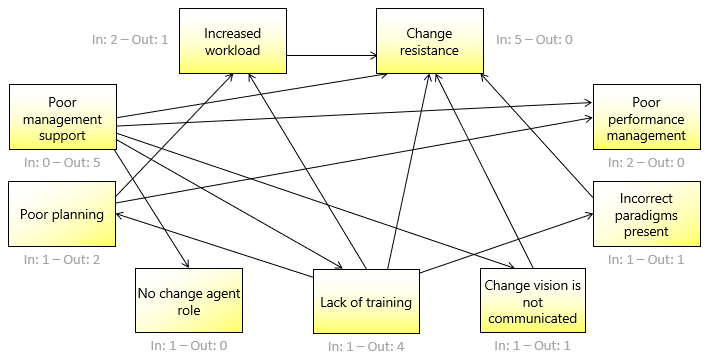
Note that arranging the nodes in a circular format simplifies their connection, particularly in complex scenarios.
Wrapping Up
An interrelationship diagram is a tool that visually displays all cause-and-effect relationships in a complex problem. It is often used in Six Sigma projects to identify and analyze complex connections and influences within a process. This tool helps in problem-solving, decision-making, and team communication, which ultimately contributes to the success of your process improvement initiatives.
References
Rob, M. Crown Holdings. Process Improvement Program.
A Guide to the Project Management Body of Knowledge. (2013). Project Management Institute, Inc.
Kubiak, T. M. (2012). The Certified Six Sigma Master Black Belt. Infotech.
Other Formats
Do you want to use the slides in your training courses?
Interrelationship Diagram Training Material – $14.85
Related Articles
Related Templates