Welcome to our Infographics section!
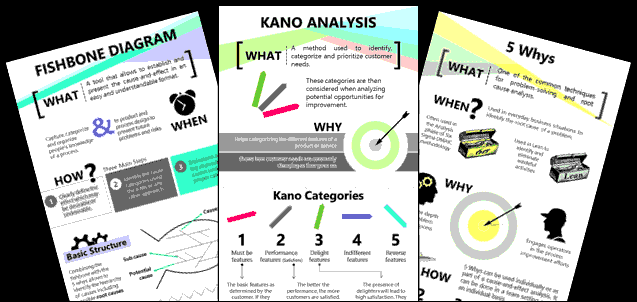
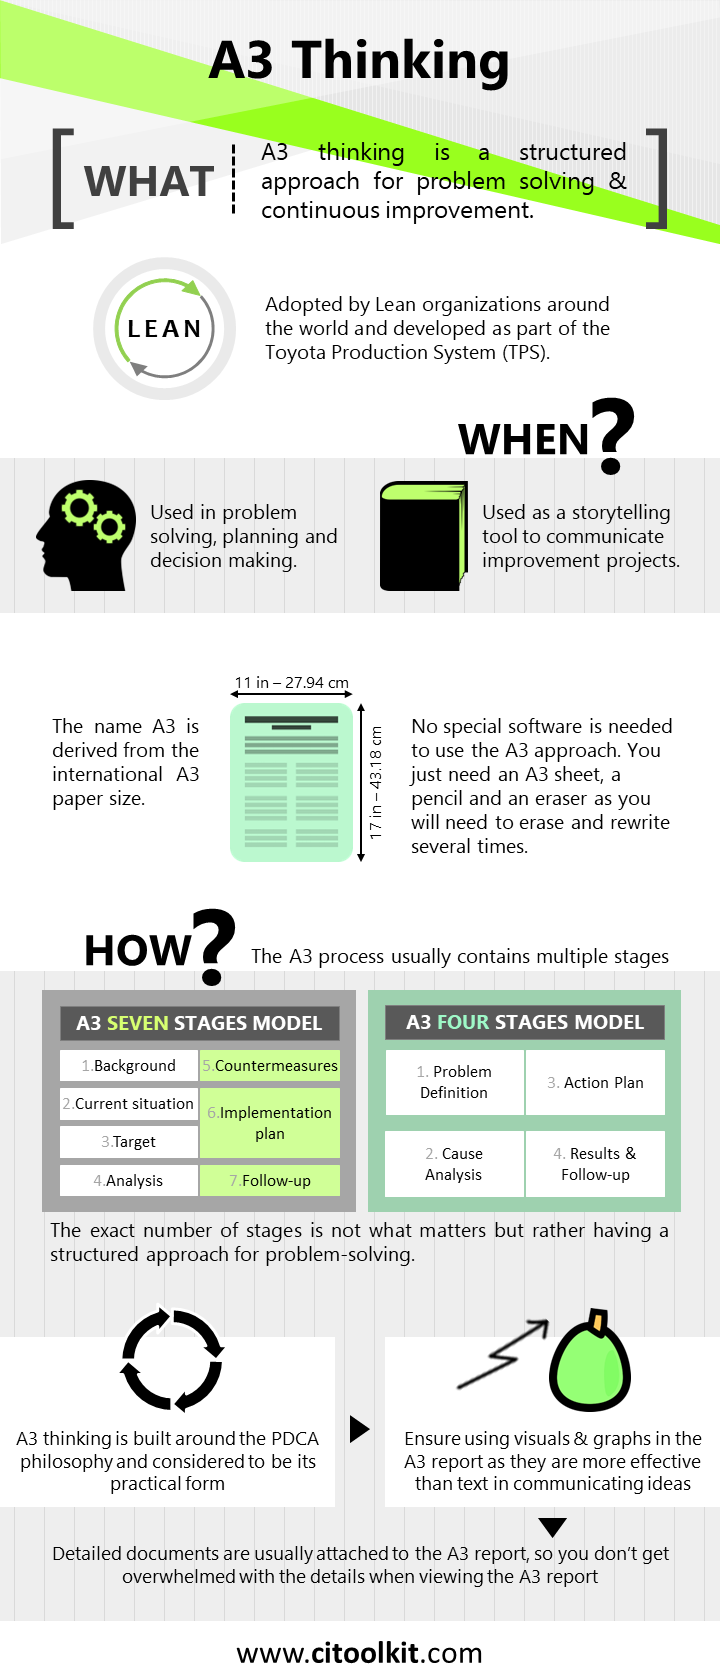
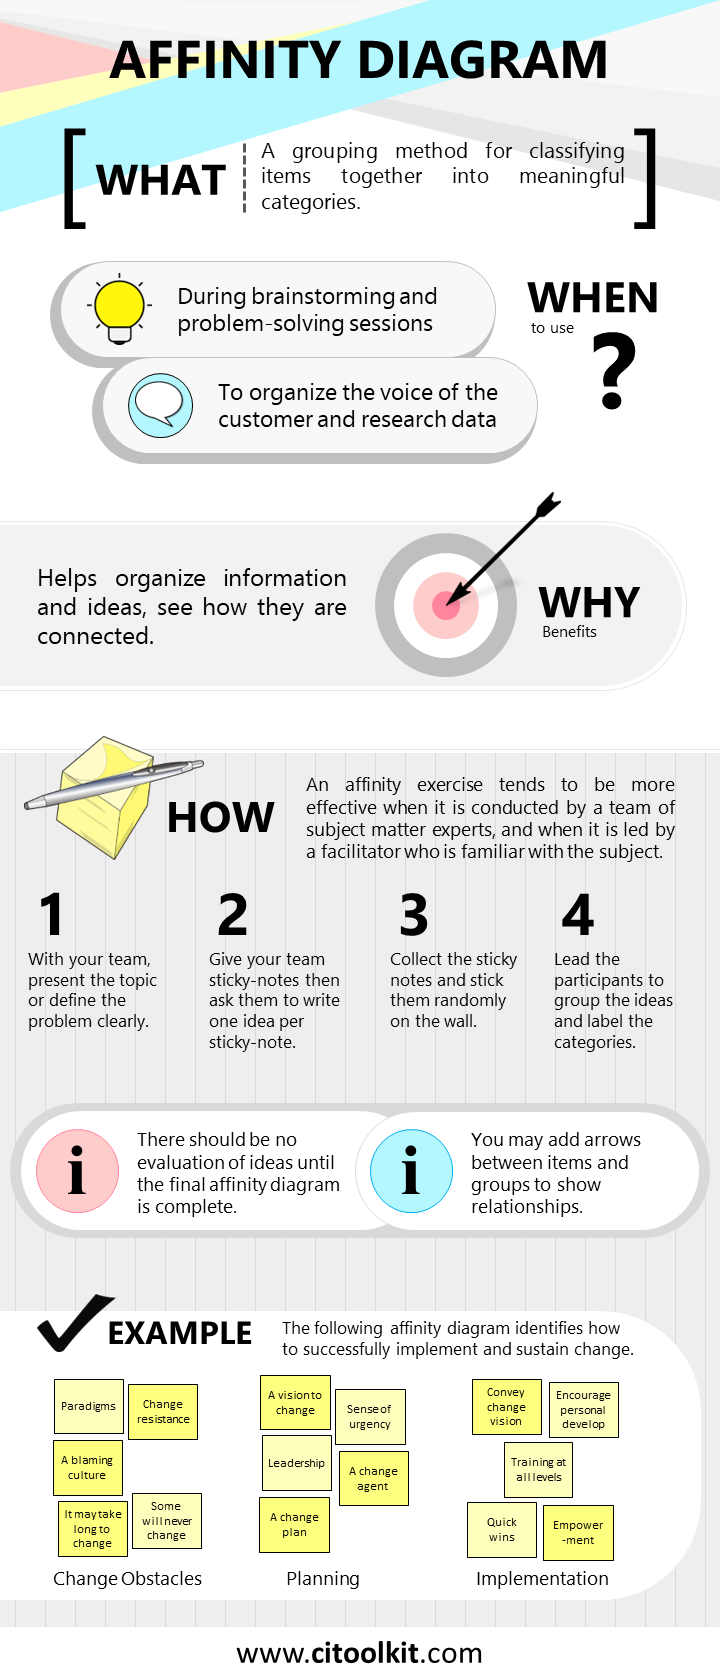
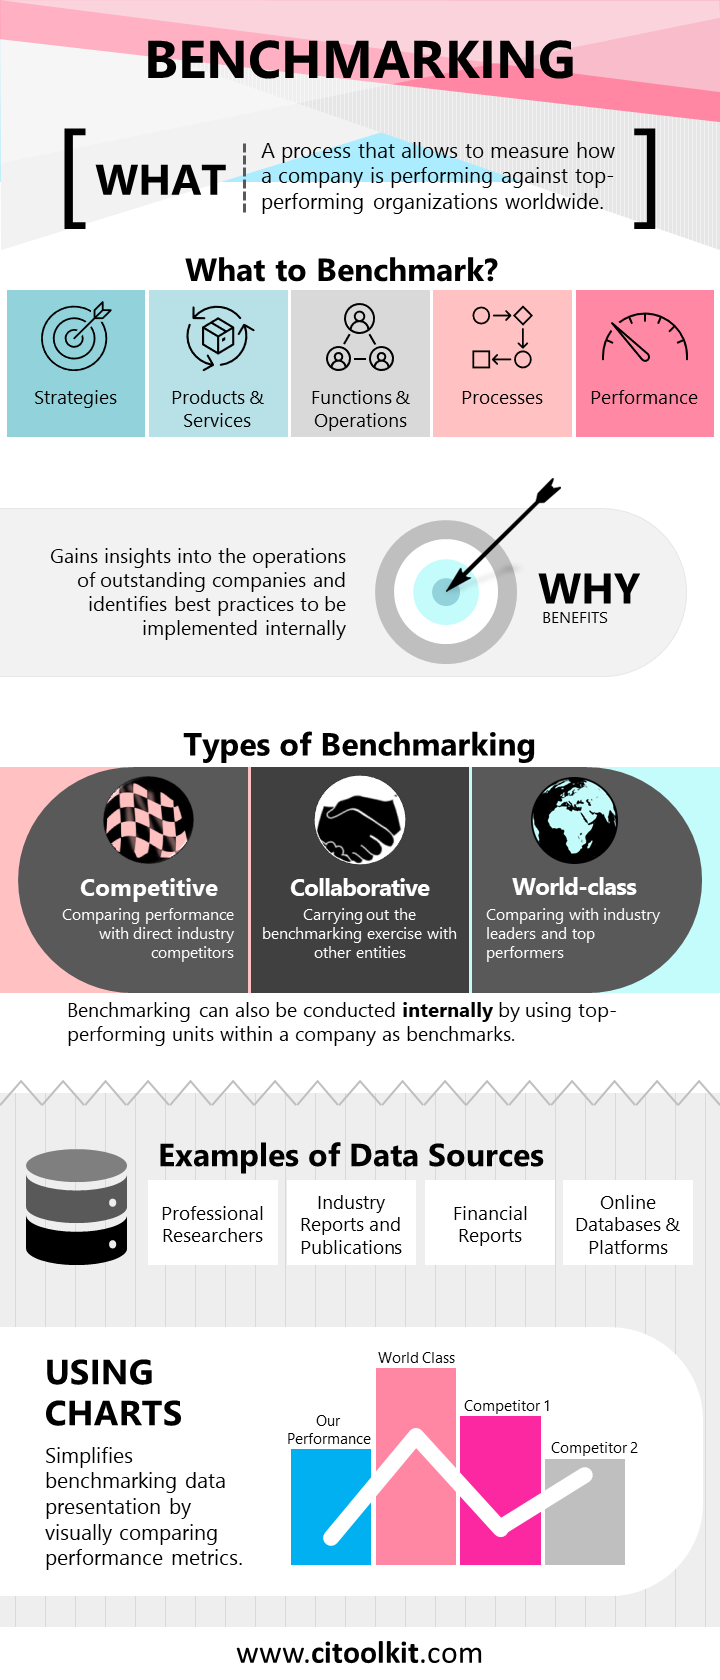
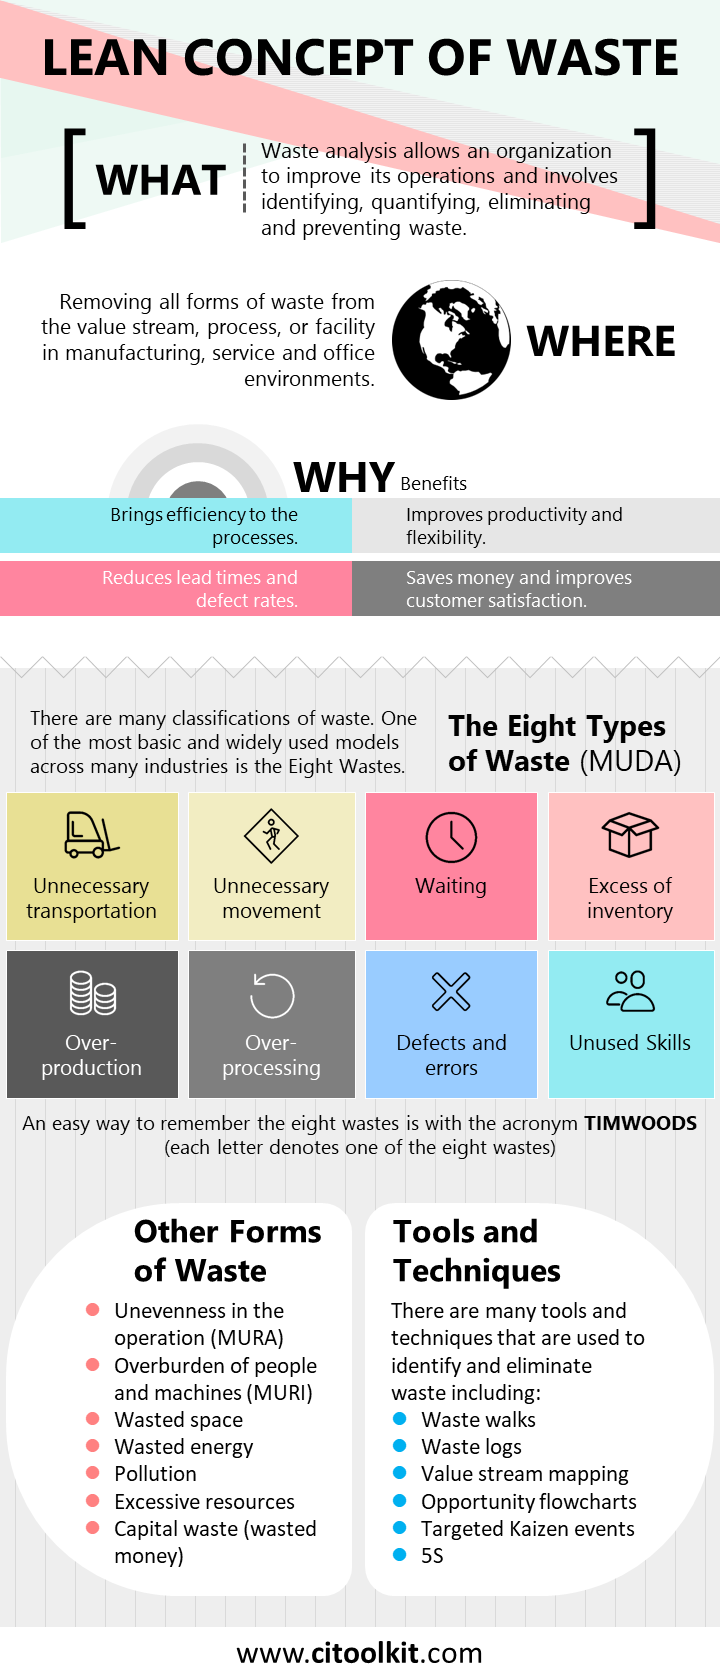
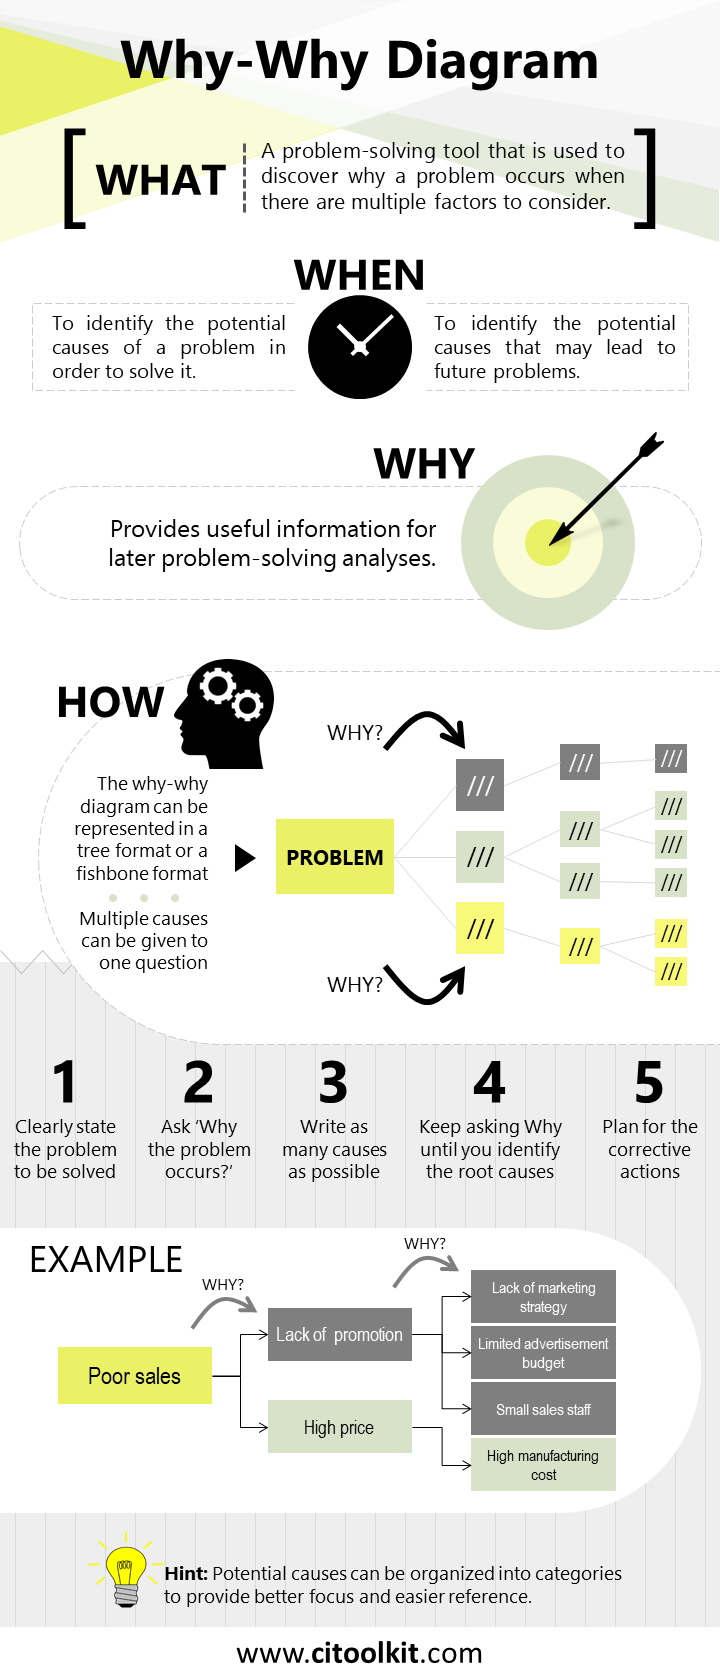
The purpose of this section is to provide all the continuous improvement tools in an infographic format. These flashcards are easy to read and understand, and very useful if you are looking for brief, concise, and to-the-point summaries. They are quick refreshers for continuous improvement and can speed up the learning process.
Note that all these infographics are available in PNG format, and can be downloaded, printed, and shared with your colleagues and friends.


Click the button below to purchase the entire set of flashcards featured above.
Continuous Improvement Infographics – $89.85
- Version 4.8.
- 61 editable MS PowerPoint Slides (.PPTX).
Please note that these slides are continuously evolving. After purchase, you can always access the latest version by downloading it from the Customer Dashboard section on our website.

