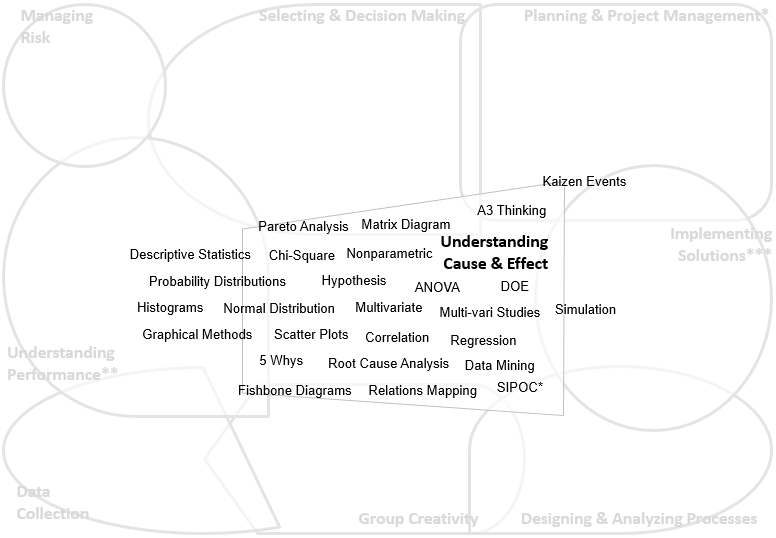
Explore methods to analyze data and identify the causes of undesirable effects and the sources of process variation. Note that the editable PowerPoint versions are available to buy from our Shop page.
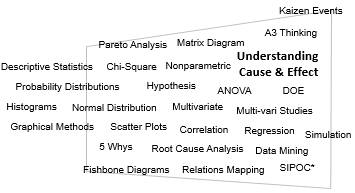
Examples of our slides
5 Whys
5W1H
Histogram
Fishbone Diagram
Pareto Analysis
Relationship Map
Matrix Diagram
Interrelationship Diagram
Scatter Diagram
SIPOC
A3 Thinking
Why-Why Diagram
FMEA
Box Plot
Brainstorming
Kaizen Event
