Continuous Improvement Toolkit
Effective
Tools
for Business and Life!
Search
Libraries
Articles
Templates
Slides
Posters
Infographics
Examples
Exercises
Maps
CI Map
Lean Tools Guide
Yellow Belt Guide
Green Belt Guide
Black Belt Guide
PMBOK Tools
Change Tools
DMAIC Process Guide
Basic Quality Tools
Blog
Shop
Tag:
template
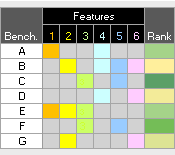
Benchmark Identification Template
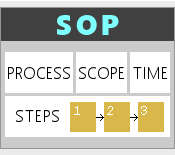
Standard Operating Procedure Template
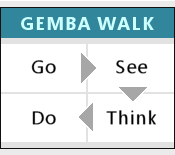
Gemba Walk Template
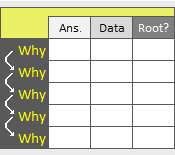
5 Whys Template
PDCA Template
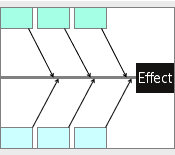
Fishbone Diagram Template
Time Value Map Template
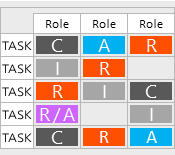
RACI Matrix Template
SWOT Analysis Template
PESTLE Analysis Template
Affinity Diagram Template
Stakeholder Analysis Template
Next Page
→