Continuous Improvement Toolkit
Effective
Tools
for Business and Life!
Search
Libraries
Articles
Templates
Slides
Posters
Infographics
Examples
Exercises
Maps
CI Map
Lean Tools Guide
Yellow Belt Guide
Green Belt Guide
Black Belt Guide
PMBOK Tools
Change Tools
DMAIC Process Guide
Basic Quality Tools
Blog
Shop
Category:
Articles
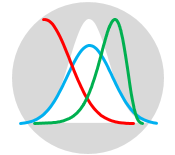
Probability Distributions
Descriptive Statistics in Minitab
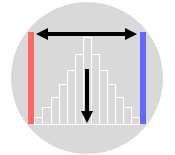
Descriptive Statistics
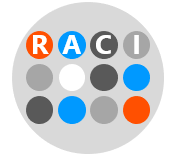
How RACI Matrix Streamlines Stakeholder Engagement
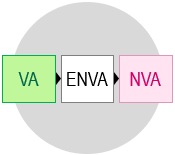
Lean Concept of Value
Lean Concept of Waste
Risk Analysis
Applying the PDCA Cycle: A Blueprint for Continuous Improvement
Value Stream Mapping: A Visual Approach to Process Optimization
The Role of Fishbone Diagram in Analyzing Cause and Effect
Putting Prioritization Matrix into Practice for Effective Decision-Making
Project Charter Components: The Power of the One-Page Document
←
Previous Page
Next Page
→